MARKET PATTERNS DASHBOARD
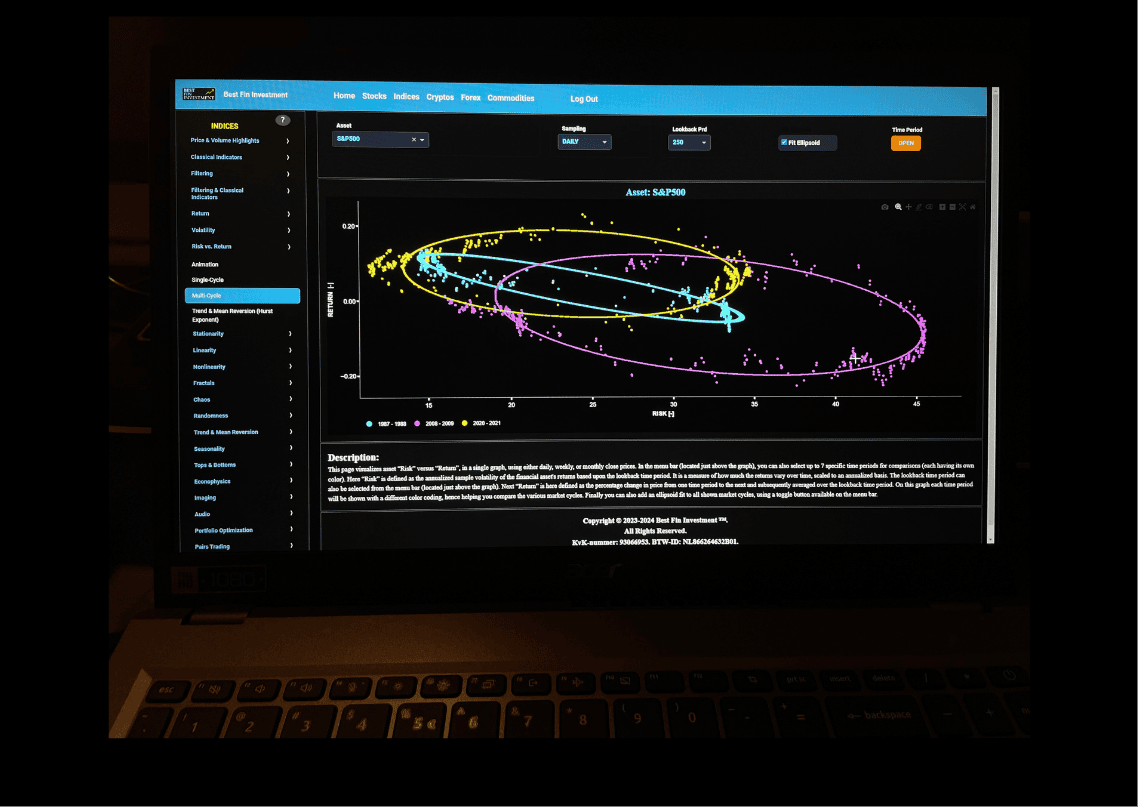

Achieve More with Elite Strategies
At Best Fin Investment
we offer you
25+ years of quantitative expertise
Through an exclusive and
innovative Dashboard
This will enable you
to make informed, rational, and
optimized financial decisions

Transformative Financial Education
We offer
a sophisticated and proprietary
financial education platform
Providing actionable and data-driven
financial insights
To empower your financial ambitions
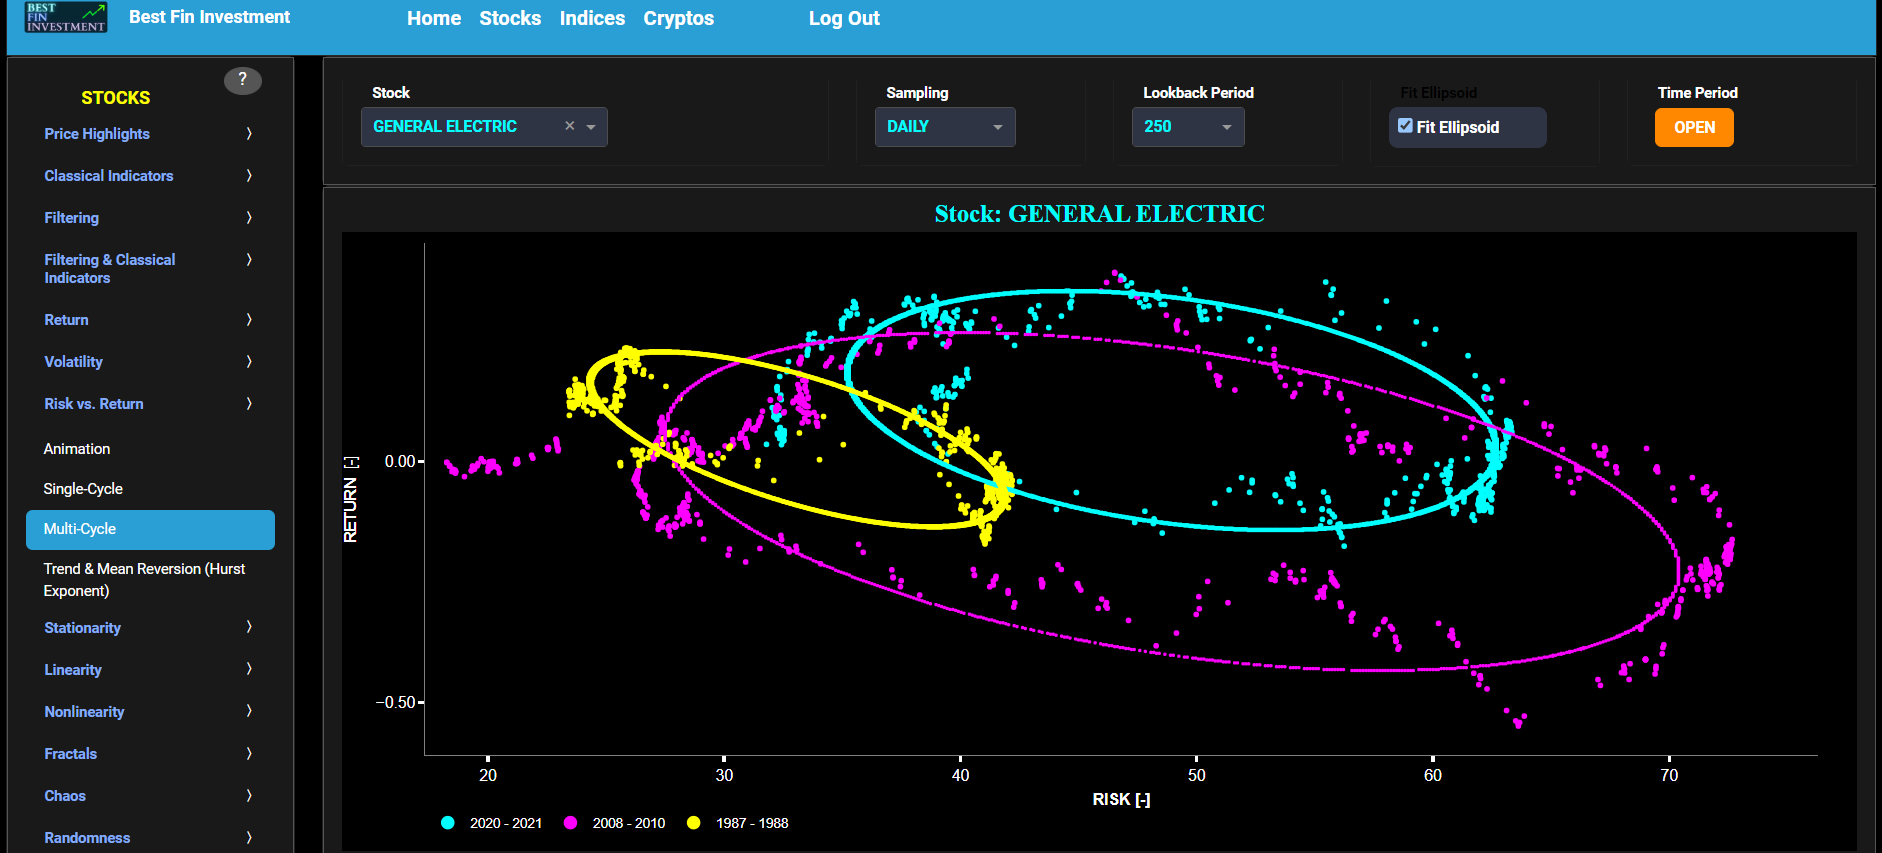
Convergence of Science, Engineering,
and Finance
We synergize our passion
for science, engineering, and finance
to deliver an unparalleled educational experience
through our innovative Dashboard
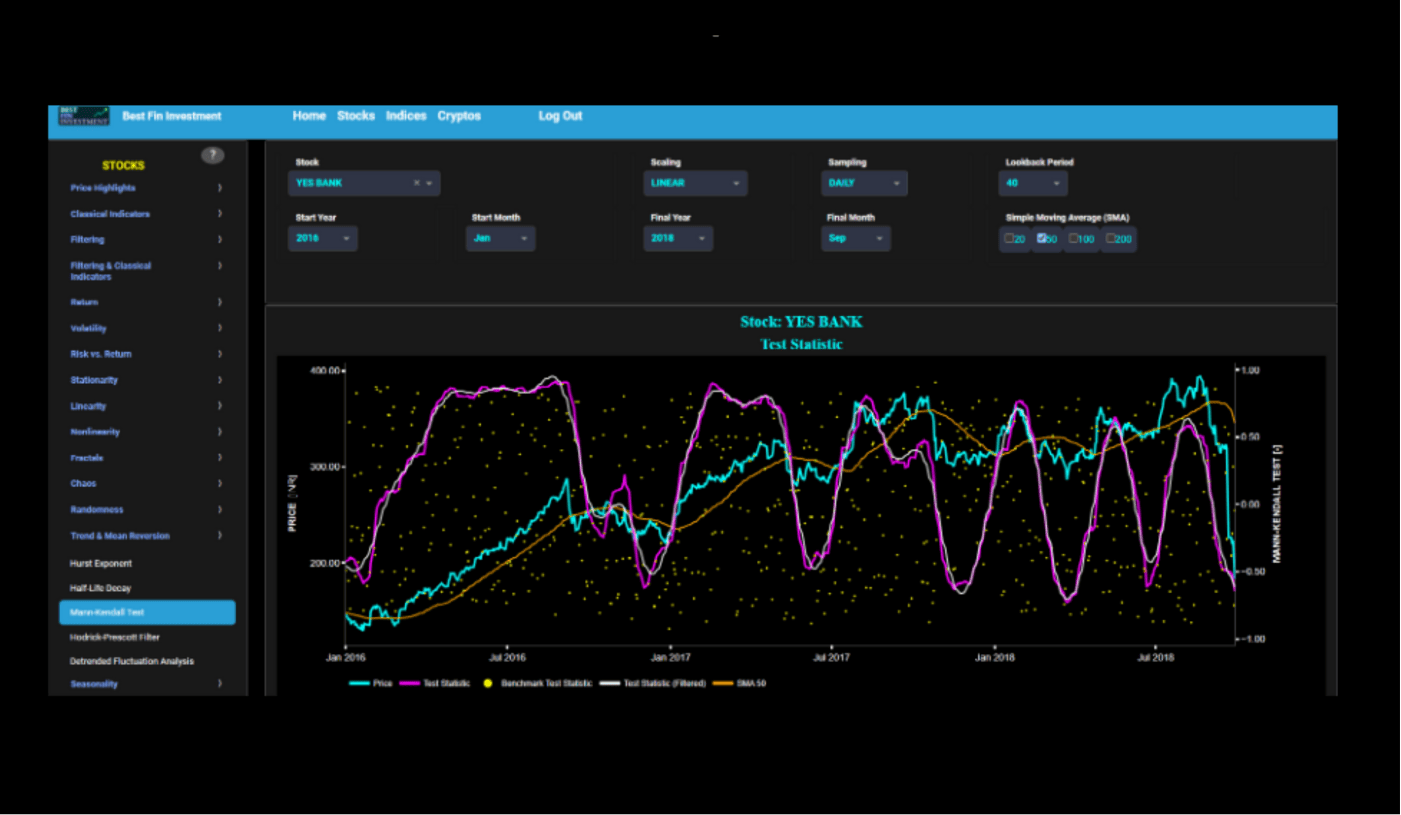
Uncovering Financial Market Patterns
Our innovative Dashboard
will transform the invisible into the visible
The Dashboard will allow you
to discover and analyze
a wide range of financial market patterns
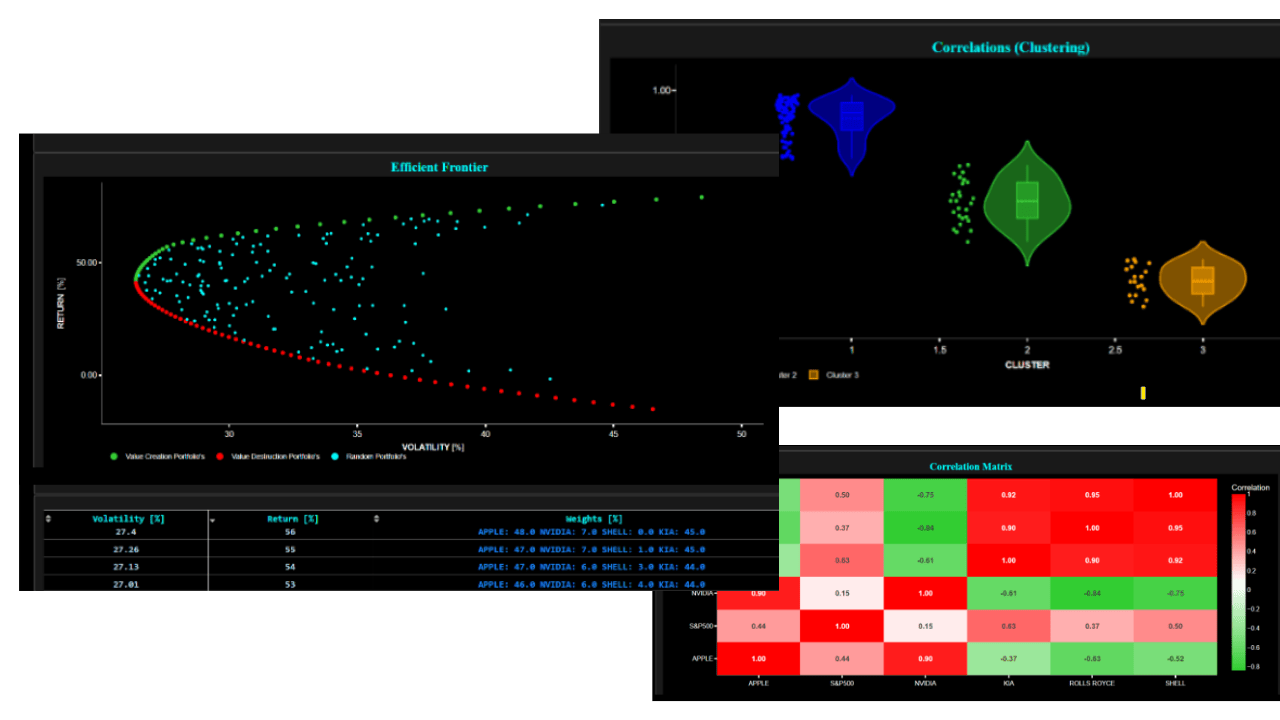
Quantitative Proficiency
Where Do You Stand?
With the Best Fin Investment Dashboard
you can navigate through
a broad spectrum of indicators
- Classical Indicators
- Seasonality
- Trend & Mean Reversion
- Return & Volatility Analysis
- Risk vs. Return
- Correlations & Cointegrations
- Tops & Bottoms
- Linearity & Nonlinearity
- Stationarity & Randomness
- Fractals & Chaos
- Frequency & Wavelets Filtering
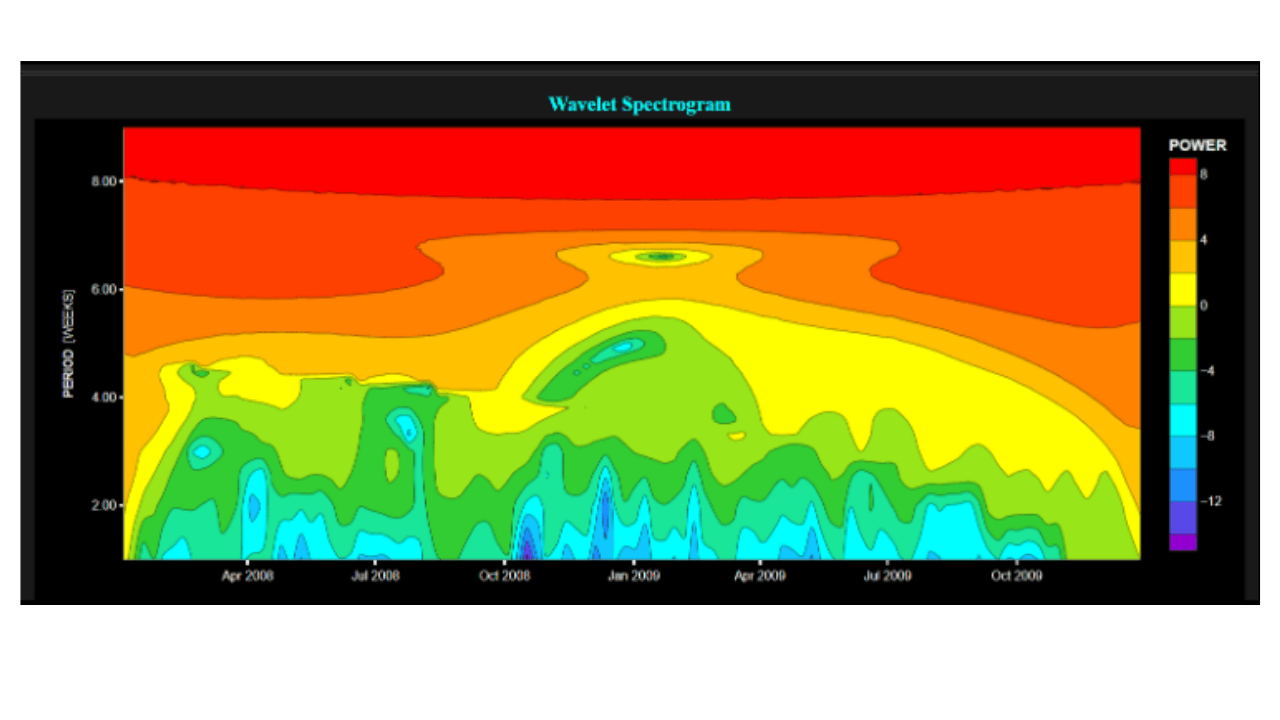
- Wavelet Spectrograms
- Agent-Based Models
- Portfolio Optimization
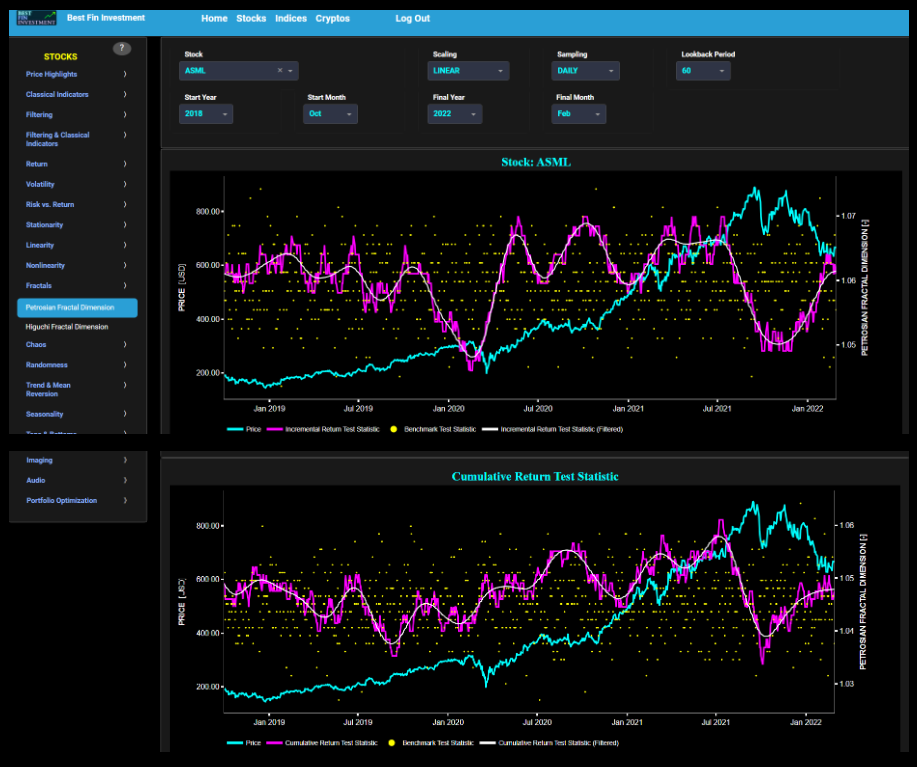
Smart Financial Decisions
Powered by Data-Driven Insights
Navigate your financial strategies
with our sophisticated Dashboard
designed for optimal decision-making
Market Projections
Identify patterns using Trend & Mean-Reversion analysis
Risk Management
Study Volatility and navigate Risk vs Return cycles
Seasonality Analysis
Uncover impact of Day of Week and Day of Month
Pairs Trading
Analyze correlations and cointegrations to build robust trading pairs
Portfolio Diversification
Explore time-varying asset correlations
Portfolio Optimization
Achieve optimal asset allocation through Risk vs Return trade-offs
Machine Learning Integration
Export images to train your own Deep-Learning models
Interactive Learning
Customize your financial analyses through flexible configurations

Data-Driven Tool
Our Dashboard thrives upon
100% quantitative and data-driven analysis
Systematic Data Exploration
Using rigorous inquiry and principles
coming from a range of disciplines
allows to create a common groundwork of
explanations and forecasts

Educational Journey
Our intuitive Dashboard will guide you through
various scientific indicators and models
giving you a deep understanding of market cycles
Personalized Strategies
Leverage your analytical skills
and create your personalized investment strategies

Experience Unmatched Value
Benefit from the compilation of over 25 years
of Best Fin Investment quantitative
and multidisciplinary knowledge and expertise
Wall Street Strategies
for Main Street Investors
Placing the tools and insights
usually reserved for Top Wall Street professionals
directly into your hands

Seamless Onboarding Experience
Sign Up in just 1 simple quick step
for instant access
Tailored Insights for All Levels
Navigate from user-friendly
foundational indicators
to advanced quantitative concepts

Join Our Community
Connect with like-minded enthusiasts
on our Forum and Social Media Pages
Learn from Others and Share
Exclusive to our subscribers
our Forum page allows you to engage
with fellow members
through insightful posts and comments
Share market updates, insights, experiences
lessons learned and success stories

Embark on a Journey of Discovery
Create
your personalized financial experiences
Enrich
your quantitative
and data-driven financial expertise
Empower
your life aspirations!