NonLinear Metrics: Useful?
Blog Post by Best Fin Investment
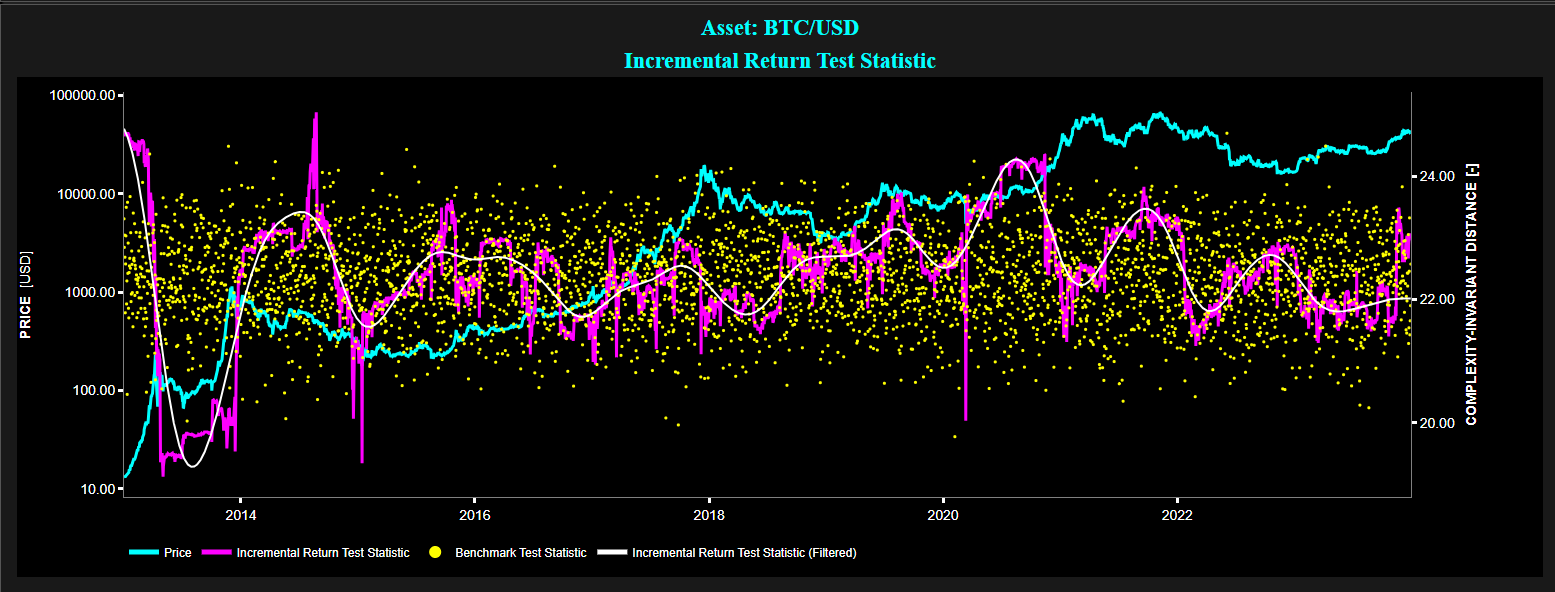
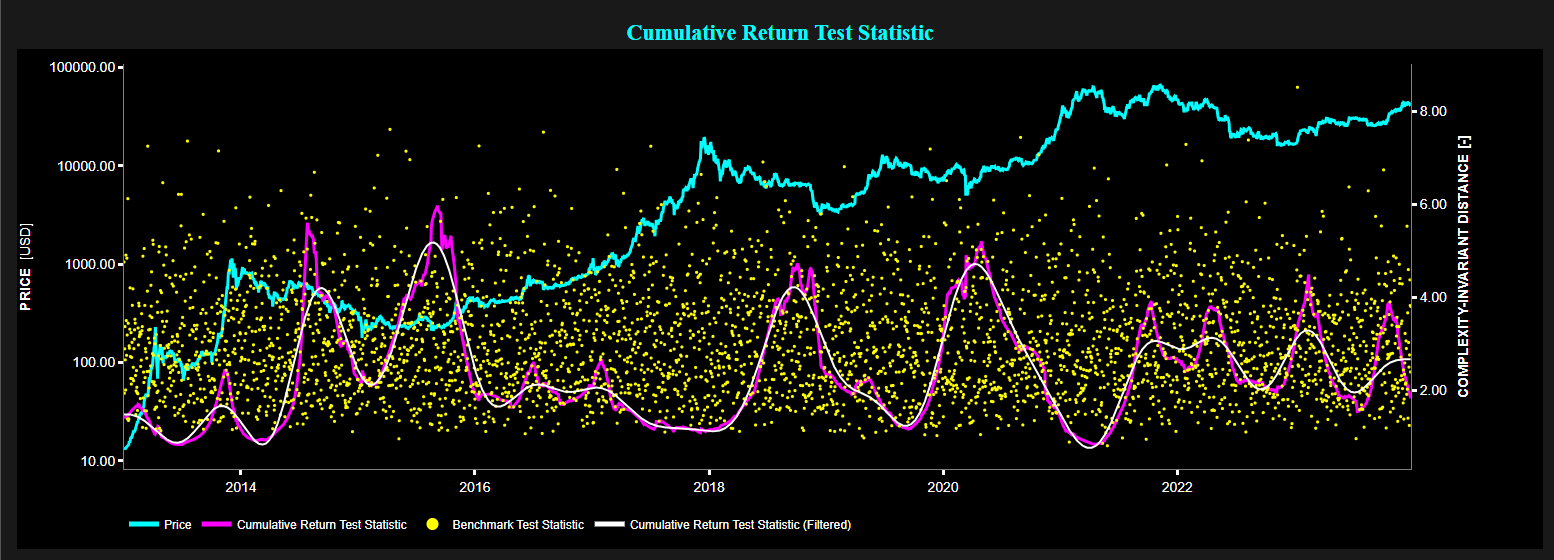
Example of Complexity-Invariant Distance (CID) test statistic on daily Bitcoin price (using a 250-day lookback window) for the period 2013 - 2023.
Top graph: Bitcoin price on Log scale (cyan color), CID test statistic of incremental return (magenta color), filtered CID test statistic of incremental return (white color), and CID test statistic for a benchmark process (yellow color).
Bottom graph: Bitcoin price on Log scale (cyan color), CID test statistic of cumulative return (magenta color), filtered CID test statistic of cumulative return (white color), and CID test statistic for a benchmark process (yellow color).
Source: Best Fin Investment Dashboard.
Table of Contents:
- Introduction
- Linear Metrics & Financial Markets properties
- Linear Framework for Trading Strategies
- NonLinear Metrics & Stylized Facts
- From Linear Efficiency to Nonlinear Inefficiency in Markets?
- Robustness versus Performance Tradeoff
- Conclusion
- Explore NonLinear Metrics on the Best Fin Investment Dashboard
- References
- Related Articles
- Books from the References Section
- Additional Reads on Nonlinear Dynamical Systems
Introduction:
Financial markets are dynamic and intricate ecosystems shaped by a myriad of variables that impact asset prices. In navigating this complexity, the choice between linear and nonlinear tools for analysis, interpretation, or trading hinges on the contextual nuances of the market environment. While linear tools may suffice in certain scenarios, offering simplicity and ease of interpretation, there are situations where the intricacies of market dynamics demand the application of nonlinear methodologies.
Linear Metrics & Financial Markets properties:
Traditionally, linear models and tools of signal processing have long been employed to analyze financial market data. A few use cases include:
- Autocorrelation of Returns: Linear autocorrelation analysis, and other metrics such as the Ljung-Box and Durbin-Watson tests are often used in linear time series analysis to check for the presence of autocorrelation.
- Stationarity Analysis: Linear time series analysis can be used to assess the stationarity of financial data, where statistical properties like mean and variance remain constant over time. Tests like the Augmented Dickey-Fuller (ADF) test are commonly employed in this context.
- Identifying Seasonality, Detecting Trends, and Forecasting: AutoRegressive Integrated Moving Average (ARIMA) models can help identify underlying trends, seasonality, and patterns in financial data, and may help generate predictions for future movements.
- Mean Reversion: Linear models can elucidate mean reversion phenomena, where asset prices tend to revert to their historical mean over time. This concept is often analyzed using linear regression, moving averages, or the Johansen test, which is a linear test that helps detect cointegration among multiple time series.
Linear Framework for Trading Strategies:
Suppose we try to forecast prices by extrapolating a historical price series.
While a nonlinear model might fit the historical data more accurately, there is no guarantee that it will predict future values better, given the notorious susceptibility of nonlinear models to data snooping bias (i.e. tendency for overfitting, which occurs when a model cannot generalize and fits too closely to the training dataset instead).
Therefore, an effective approach in constructing trading strategies is to opt for simplicity, particularly by selecting models within the linear framework and with minimal parameters [3]. In a way, this linear versus nonlinear model discussion parallels the underfitting versus overfitting model building discussion.
NonLinear Metrics & Stylized Facts:
Nonlinear systems may offer insights and explanations of some of the so-called stylized facts observed in financial markets. By stylized facts we refer to nontrivial statistical properties that are consistent enough to be generally accepted as truth:
- Nonlinear properties of asset returns: As noted by Professor R. Cont "traditional tools of signal processing which are based on second-order properties, in the time domain (autocovariance analysis or AutoRegressive Moving Average modeling) and in the spectral domain (Fourier analysis or linear filtering) cannot distinguish between asset returns and white noise" [4].
This limitation underscores the necessity of employing nonlinear measures to accurately characterize the complex dependence properties of asset returns. In addition the interpretation of asset returns cannot be done from a linear viewpoint. As pointed out by Professor N. Taleb "a 2% move is not twice as significant an event as a 1%, it is rather like four to ten times. A 8% move can be several billion times more relevant than a 1% move!" [8]
- Long-Range Memory in Nonlinear Functions of Price Return: It was shown that the autocorrelation of absolute returns decays slowly as a function of the time lag (roughly as a power law) [4]. Further the autocorrelation of the sign of trades is also very long-range correlated, over several days or maybe even months [1].
Here nonlinear techniques can help explain these observed long memory characteristics. For example, nonlinear models such as fractional Brownian motion, or multifractal models, may offer frameworks to capture this temporal dependence and the presence of multifractal scaling in asset returns [7].
- Volatility Clustering: To elucidate such a phenomena, which may stem from intermittent chaotic motion or the simultaneous presence of various attractors (such as the coexistence of stable steady-state and stable limit cycles) [5], one may require the analytical framework provided by nonlinear dynamical systems theory.
- Regime Shifts: Here nonlinear metrics may be able to detect regime shifts or abrupt changes in market behavior, where the underlying dynamics switches between different states or regimes.
From Linear Efficiency to Nonlinear Inefficiency in Markets?
The absence of linear autocorrelations in asset returns means that price returns remain linearly unpredictable, in other words financial markets may be seen as indeed efficient, however only in this linear framework. It is also this absence of linear autocorrelations that has historically lent support to random walk models of prices, where price returns are considered independent random variables [6], where as pointed out by Professor J.P. Bouchaud "liquidity providers and liquidity takers offset each other, to remove most of the linearly predictable patterns that their actions would otherwise create" [2].
Interestingly this linear unpredictability of price returns is indeed needed to compensate for the presence of strong, long-range autocorrelations in order flows [2].
However, the lack of linear autocorrelations in asset returns does not necessarily imply independence of asset returns. Independence represents a stricter condition compared to linear uncorrelatedness. While independence implies uncorrelatedness, the reverse is not necessarily true. Linear uncorrelatedness only rules out a linear relationship but does not exclude the possibility of a nonlinear relationship. Therefore, even if price returns are linearly uncorrelated, they might still be dependent through nonlinear relationships.
For instance, even basic nonlinear functions of returns, like absolute or squared returns, often demonstrate notable positive autocorrelation or persistence. This phenomenon may also extend to nonlinear functions applied to price time series, such as the logarithm of prices.
Therefore, and even though price returns may remain linearly unpredictable, one might contend that nonlinear price patterns may be identified, suggesting the presence of market inefficiencies in the nonlinear framework.
Robustness versus Performance Tradeoff:
Our aforementioned linear vs nonlinear discussion is to some extent reminiscent of the robustness versus performance tradeoff observed in control engineering. Control engineering is a branch of engineering that deals with the design, analysis, and implementation of dynamical systems to regulate or manipulate the behavior of other dynamical systems. It involves the use of mathematical models, algorithms, and control theory principles to manage the dynamic behavior of systems and ensure desired performance criteria are met. Applications include industrial processes, aerospace systems, robotics, and automotive systems.
Now the robustness versus performance tradeoff in control engineering refers to the balance between the stability and responsiveness of a control system:
- Robustness refers to the ability of a control system to maintain stability and satisfactory performance despite uncertainties or disturbances in the system or its environment. A robust control system can tolerate variations or perturbations without losing stability or significantly degrading its performance.
- Performance, on the other hand, relates to how well a control system achieves its desired objectives, such as tracking a reference signal or rejecting disturbances. High-performance control systems typically exhibit fast response times and accurate tracking.
This robustness versus performance tradeoff arises because enhanced control performance often involves making the control system more sensitive to changes in the system or its environment. This increased sensitivity can make the system more vulnerable to uncertainties, disturbances, or variations that it may encounter in real-world operation. Conversely, prioritizing robustness may involve sacrificing some performance to ensure that the system remains stable and effective under a wide range of conditions [9].
In the realm of finance, choosing linear models or linear metrics resembles opting for robustness, as the linear framework is likely to cover a broad range of the operating regime while being less sensitive to unknown disturbances. Conversely, selecting nonlinear models or nonlinear metrics may offer higher performance but is likely confined to a much narrower operating regime and is more susceptible to the impact of unknown inputs.
In particular, when constructing trading strategies, the choice between linear and nonlinear models mirrors this age-old debate between robustness and performance. Opting for simplicity and robustness within the linear framework can provide broad coverage across market conditions, mitigating the risk of overfitting and data snooping bias.
On the other hand, nonlinear models may offer higher performance within a narrower operating regime but at the cost of increased sensitivity to market dynamics and increased risk towards model overfitting.
Conclusion:
Financial markets, characterized by their complexity and dynamism, present a rich tapestry of data that can be analyzed using both linear and nonlinear methodologies. The choice between these approaches hinges on the context-specific intricacies of market behavior and the objectives of analysis, interpretation, or trading.
Linear metrics and tools, entrenched in traditional signal processing techniques, have long been the bedrock of financial analysis. On the other hand nonlinear approaches offer new insights and opportunities for improving our understanding of market behavior and enhancing predictive models.
Ultimately, navigating the linear and nonlinear landscape in financial markets requires a nuanced understanding of both approaches and their respective strengths and limitations.
Explore NonLinear Metrics on the Best Fin Investment Dashboard:
- Entropy Test
- Lempel-Ziv Complexity Test
- Complexity-Invariant Distance Test
- C3 Nonlinear Test
- Brock–Dechert–Sheinkman Test
- Hjorth Complexity Test
References:
[1] Bouchaud J.P., "The endogenous dynamics of markets: price impact, feedback loops and instabilities", Lessons from the credit crisis, pp.345-74, 2011.
[2] Bouchaud J.P., Bonart J., Donier J., Gould M.,"Trades, Quotes and Prices: Financial Markets Under the Microscope", Cambridge University Press, 2018.
[3] Chan E.P., "Algorithmic Trading: Winning Strategies and Their Rationale", Wiley, 2013.
[4] Cont R., "Empirical properties of asset returns: stylized facts and statistical issues", Quantitative Finance, vol. 1, issue 2, pp. 223-236, 2001.
[5] Hommes, C., "Modeling the stylized facts in finance through simple nonlinear adaptive systems", Proceedings of the National Academy of Sciences of the United States of America, vol. 99, issue 10, pp. 7221–7228, 2002.
[6] Malkiel B.G., "A Random Walk Down Wall Street", W.W. Norton & Company, 2020.
[7] Mandelbrot B., Hudson R.L., "The (Mis)Behaviour of Markets: A Fractal View of Risk, Ruin and Reward", Profile Books Ltd , 2008.
[8] Taleb N.N., "Fooled by Randomness: The Hidden Role of Chance in Life and in the Markets", Penguin Books, 2004.
[9] Zhou K. , Doyle J., "Robust and Optimal Control", Prentice-Hall, 1996.