Fractals: Decoding Market Irregularities
Blog Post by Best Fin Investment
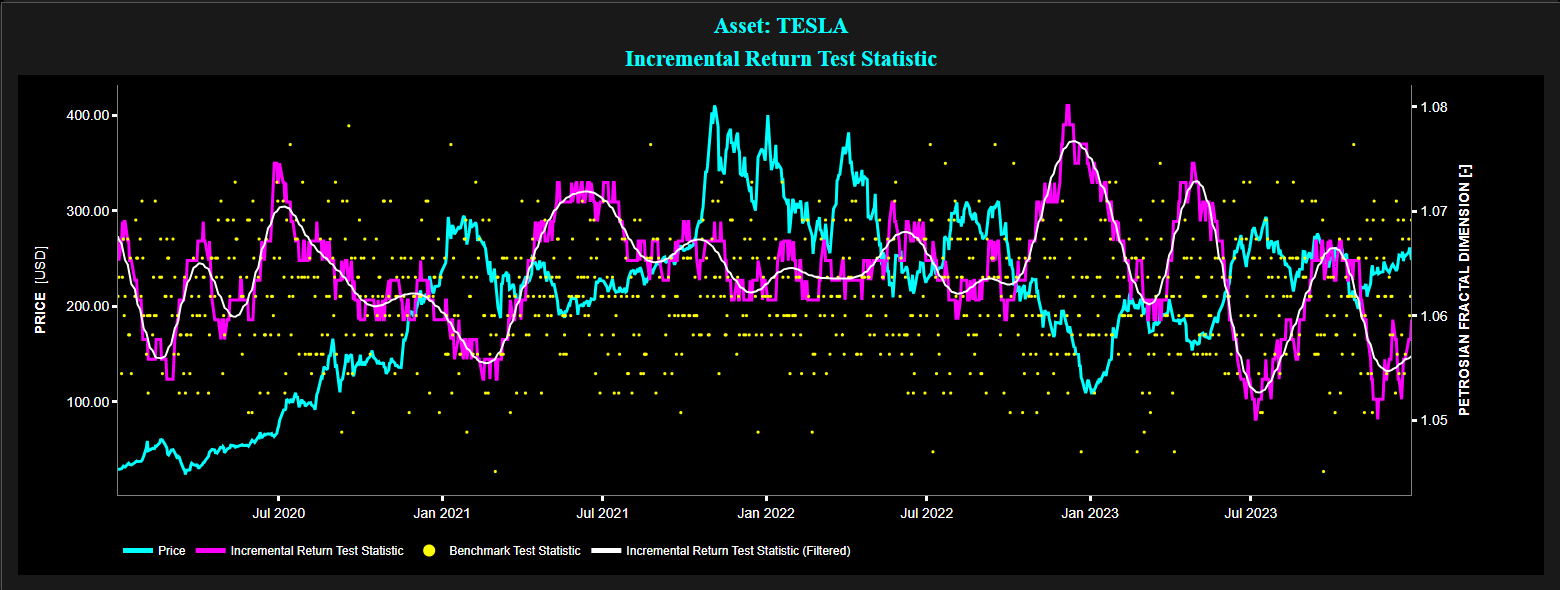
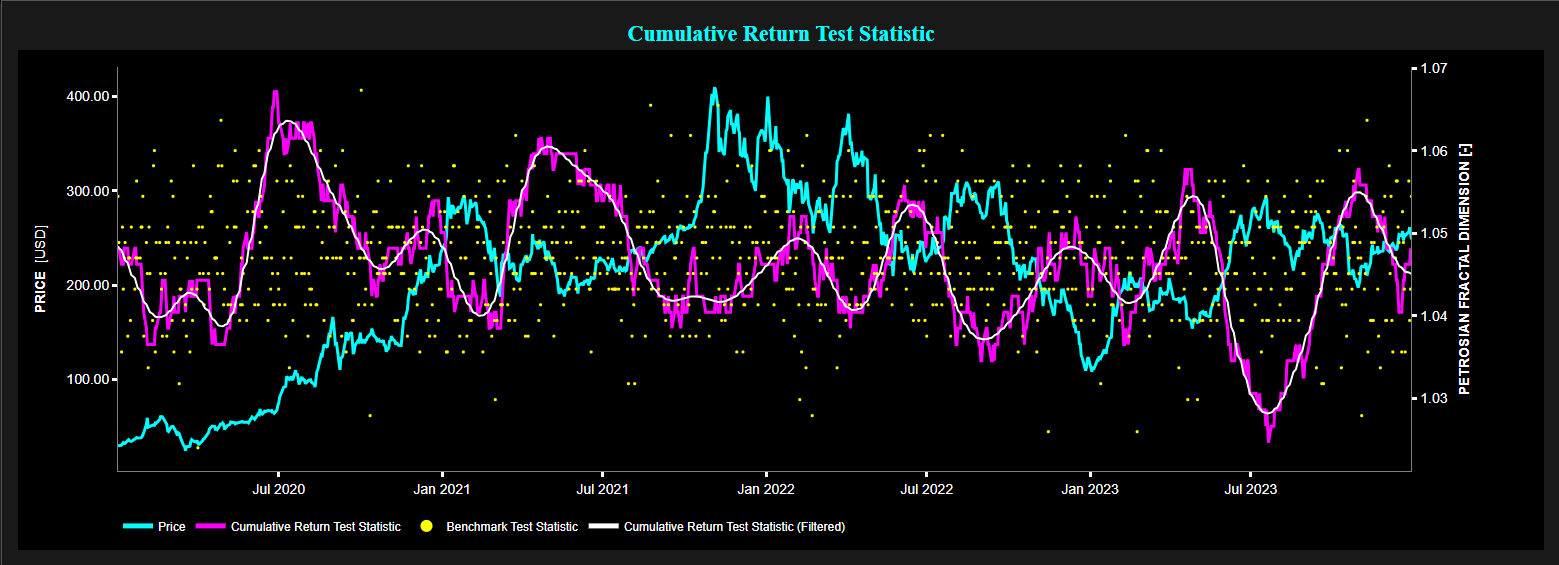
Example of Petrosian Fractal Dimension (PFD) test statistic on daily TESLA stock price (using a 50-day lookback window) for the period 2020 - 2023.
Top graph: TESLA price (cyan color), PFD test statistic of incremental return (magenta color), filtered PFD test statistic of incremental return (white color), and PFD test statistic for a benchmark process (yellow color).
Bottom graph: TESLA price (cyan color), PFD test statistic of cumulative return (magenta color), filtered PFD test statistic of cumulative return (white color), and PFD test statistic for a benchmark process (yellow color).
Source: Best Fin Investment Dashboard.
Table of Contents:
- Introduction
- Understanding Fractals
- Fractals in Financial Markets
- Petrosian Fractal Dimension (PFD)
- Higuchi Fractal Dimension (HFD)
- Conclusion
- Explore Fractals Metrics on the Best Fin Investment Dashboard
- References
- Related Articles
- Books from the References Section
- Additional Reads on Fractals and Financial Markets
Introduction:
Fractal and multifractal geometry, a term introduced by Professor B. Mandelbrot in 1975, explore the concept of roughness and irregularity in natural phenomena [1].
While initially conceptualized to understand the complexity of shapes in nature, fractal geometry has found applications across various fields, from digital image compression, and studying brain waves and lung bronchial anatomy, to the understanding of financial markets.
Indeed fractal geometry may provide a unique perspective for analyzing market dynamics, capturing some of the intricate patterns and irregularities inherent in financial data.
Understanding Fractals:
At the core of fractal geometry lies the concept of self-similarity, where a pattern repeats itself at different scales. The whole can be broken into smaller parts, each an echo of the whole.
As pointed out by Professor Mandelbrot "fractal is a new tool to measure, not how long, heavy, hot, or loud something is, but how convoluted and irregular it is. It provides science with its first yardstick for roughness" [1].
For instance, while a straight line has a fractal dimension of 1, complex structures like the British coastline has a fractal dimension of about 1.25, and human lungs have a fractal dimension very close to 3.
Fractals in Financial Markets:
In financial markets, the application of fractal geometry has gained prominence, especially in understanding market dynamics and price movements. The fractal nature of financial time series implies that patterns repeat at different scales, from intraday fluctuations to long-term trends.
By analyzing the fractal dimension of market data, one may gain valuable insights into market behavior [2] such as:
- Trend Identification: By identifying trends across different timeframes, from short-term fluctuations to long-term trends.
- Pattern Recognition: By recognizing recurring patterns in market data, such as fractal waves, fractal divergence, and fractal clusters.
These patterns may potentially provide valuable insights into market behavior and may also inform trading strategies.
Petrosian Fractal Dimension (PFD):
The PFD is a measure of signal irregularity or fractal-like behavior (also known as self-similarity) in a time series.
The PFD was originally developed and widely used in the field of biomedical signal analysis, particularly in electroencephalography (EEG) signal analysis.
In EEG analysis, the PFD can provide insights into the complexity of brain wave patterns, helping researchers understand neural activity and detect abnormalities.
In the realm of financial data, the PFD is particularly used when the focus is on abrupt changes, spikes, or irregularities in the data, as the PFD is sensitive to rapid sign changes and is hence suitable for capturing non-smooth patterns.
Higuchi Fractal Dimension (HFD):
Similar to the PFD, the HFD is also a measure of signal irregularity or fractal-like behavior in a time series.
The HFD was originally developed in 1988 by Dr. Tomoyuki Higuchi, a Japanese researcher who made contributions to the field of fractal analysis and signal processing.
The HFD was used in various fields, including biomedical signal analysis such as in electroencephalography (EEG) signal analysis.
In the realm of financial data, the HFD is particularly used to assess local variations and fine-scale self-similarity in data, e.g. by capturing subtle fractal-like behavior within smaller segments of a time series.
Conclusion:
Fractal geometry, with its emphasis on irregularity and self-similarity, offers a powerful lens for understanding complex systems like financial markets.
Fractal analysis may provide a framework to uncover hidden patterns and trends, guiding investment decision-making and risk management strategies.
Explore Fractals Metrics on the Best Fin Investment Dashboard:
References:
[1] Mandelbrot B., Hudson R.L., "The (Mis)Behaviour of Markets: A Fractal View of Risk, Ruin and Reward", Profile Books Ltd , 2008.
[2] Peters, E.E., "Chaos and Order in the Capital Markets: A New View of Cycles, Prices, and Market Volatility", John Wiley & Sons, 1996.