Asset Correlation: An Introduction to Basic Concepts
Blog Post by Best Fin Investment
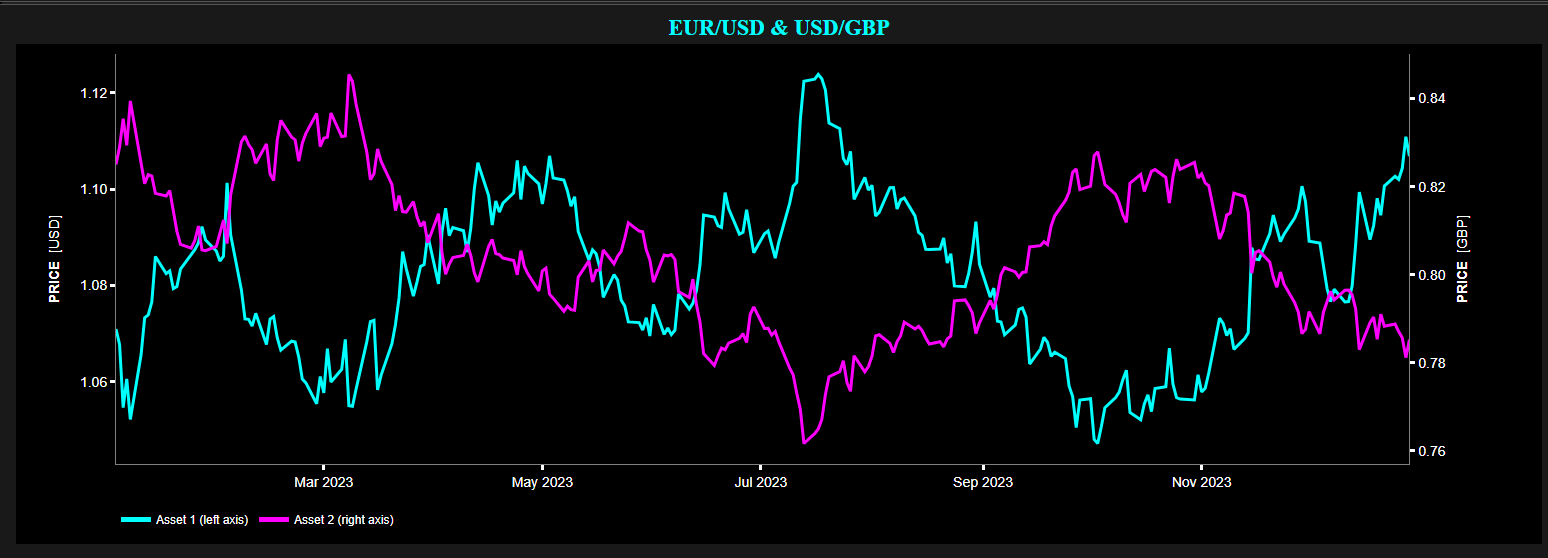
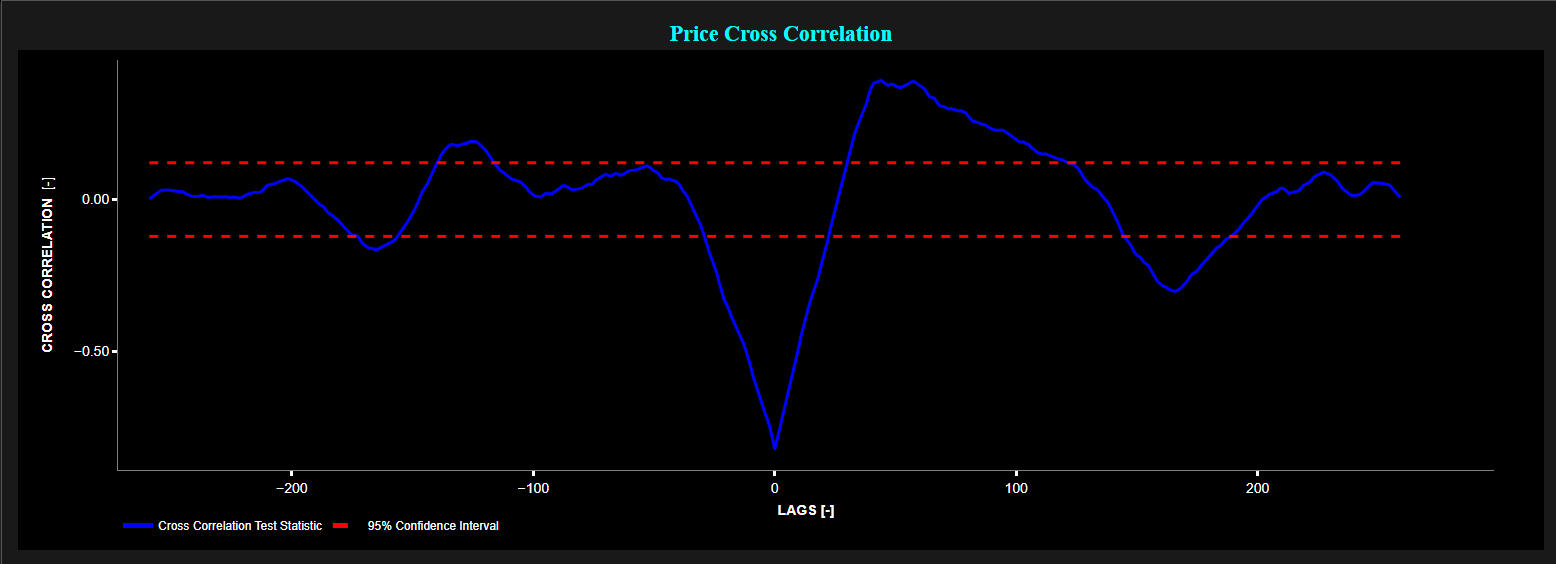
Example of Pearson Cross-Correlation test statistic using daily quotes of EUR/USD and USD/GBP for 2023.
Top graph: EUR/USD price (cyan color on left y-axis) and USD/GBP (magenta color on right y-axis).
Bottom graph: Pearson Cross-Correlation at different lags (blue color) and 95% confidence interval (red color dashed lines).
A negative lag on the x-axis (e.g. -10 units) means that changes in Asset 1 precede changes in Asset 2 by 10 time units.
Source: Best Fin Investment Dashboard.
Table of Contents:
- Introduction
- Commonly Used Correlation Coefficients in Statistics and Finance
- Correlations in Motion - Factors Impacting Their Fluctuations
- Correlations in Action - Practical Financial Applications
- Conclusion
- Explore Correlations on the Best Fin Investment Dashboard
- References
- Related Articles
- Books from the References Section
- Further Insights into Advanced Asset Correlation Concepts
Introduction:
The correlation between two assets reflects the degree to which these two assets move in relation to each other.
In particular the correlation coefficient measures the strength and direction of the relationship between those two assets.
Asset correlations play a crucial role in understanding the behavior of financial markets and constructing trading strategies and diversified investment portfolios.
Commonly Used Correlation Coefficients in Statistics and Finance:
We briefly review three of the main correlation coefficients commonly used in statistics and finance to measure the relationship between variables [9].
- Pearson: Which measures the linear relationship between two continuous variables. It ranges from -1 to 1, where a value of 1 indicates a perfect positive linear relationship (this means that as one variable increases, the other variable also increases proportionally, or alternatively, when one variable decreases, the other variable also decreases proportionally), a value of -1 indicates a perfect negative linear relationship (this means that as one variable increases, the other variable decreases proportionally), and a value of 0 indicates no linear relationship.
- Spearman's Rank: Which assesses the strength and direction of the monotonic relationship between two variables, regardless of whether the relationship is linear. It is based on the ranks of the data rather than the actual values and is suitable for both continuous and ordinal data. This coefficient also ranges between -1 and 1. Again a correlation close to 1 indicates a strong positive relationship, while a correlation close to -1 indicates a strong negative relationship. A correlation near zero suggests little to no relationship.
- Kendall Tau: Which is another non-parametric measure of correlation that assesses the ordinal association between two variables. Like Spearman's correlation, it does not assume linearity and is based on the ranks of the data. It measures the similarity of the ordering of the data pairs. This coefficient also ranges between -1 and 1 and has similar interpretations.
Correlations in Motion - Factors Impacting Their Fluctuations:
Correlations can change over time due to various factors such as:
- Changes in individual asset volatility [4].
- Shifts in market conditions: e.g. correlations tend to increase during market downturns and decrease during periods of economic expansion. As pointed out by Professor J.P. Bouchaud "several studies suggest that the rise of algorithmic trading and high-frequency market-making has substantially increased the cross-correlation between assets, particularly during crisis periods" [2].
- Occurence of global events and geopolitical tensions: e.g. financial crises, trade wars.
- Macroeconomic changes: e.g. monetary policy, interest rate changes, or other changes of macroeconomic indicators.
- Shifts in investor sentiment.
Correlations in Action - Practical Financial Applications:
Asset correlations may be useful for a range of financial applications, including:
- Pairs Trading: Which is a popular trading strategy that relies on identifying two assets with historically high correlation and trading the spread between their prices. Here the aim is to profit from temporary divergences in the prices of these two assets, taking long (asset bought) and short (asset sold) positions simultaneously. The long position benefits from an increase in price, while the short position benefits from a decrease in price [8].
- Portfolio Diversification: Low or negative correlations, between assets of a portfolio, can reduce the portfolio overall risk and enhance risk-adjusted returns (requires regular monitoring of all correlations to ensure effective diversification) [2].
- Investment Strategy: Optimizing portfolio construction (e.g. correlations between assets within the same asset class may be higher than correlations between assets from different classes) and optimizing asset allocation (e.g. using mean-variance portfolio optimization, which is an approach that uses historical performance and correlation between assets to construct portfolios that aim to maximize returns for a given level of risk or minimize risk for a target level of return) [2].
- Risk Management: Which refers to practices such as Value-at-Risk (VaR) analysis and stress testing [6]. Advanced modeling techniques also exist such as Copulas [7], multivariate Extreme Value Theory (EVT) [3], and Machine Learning (ML) algorithms [5]. These techniques have the potential to better capture nonlinear correlations and the so-called tail risk (i.e. extreme and unexpected events occurring in financial markets which typically occur in the tails of a probability distribution curve, hence the term "tail risk").
Indeed two assets may have extremal correlations (i.e. increased cross-correlation particularly during crisis periods) while their regular linear correlation is zero. In other words a linear correlation does not measure the correlation of extremes [4]. Understanding these aspects may help anticipate portfolio losses under adverse scenarios.
Conclusion:
Asset correlations are a fundamental concept in finance, influencing investment decision-making, portfolio construction, and risk management.
While correlations provide valuable insights into the relationships between assets, it is essential to recognize their dynamic nature and the multitude of factors that can influence them.
Explore Correlations on the Best Fin Investment Dashboard:
- Correlations (Historical Path)
- Correlations (Matrices)
- Cross Correlation Test
- Synchronization Measure (Mutual Information)
References:
[1] Bodie Z., Kane A., Marcus A., "Investments", McGraw-Hill Education, 2021.
[2] Bouchaud J.P., Bonart J., Donier J., Gould M., "Trades, Quotes and Prices: Financial Markets Under the Microscope", Cambridge University Press, 2018.
[3] Coles S., "An Introduction to Statistical Modeling of Extreme Values", Springer, 2001.
[4] Cont R., "Empirical properties of asset returns: stylized facts and statistical issues", Quantitative Finance, vol. 1, issue 2, pp. 223-236, 2001.
[5] Hastie T., Tibshirani R., Friedman J., "The Elements of Statistical Learning: Data Mining, Inference, and Prediction", Springer, 2001.
[6] Hull J.C., "Risk Management and Financial Institutions", Wiley, 2023.
[7] Nelsen R.B., "An Introduction to Copulas", Springer, 2006.
[8] Vidyamurthy G., "Pairs Trading: Quantitative Methods and Analysis", Wiley, 2004.
[9] Wooldridge J.M., "Introductory Econometrics: A Modern Approach", South-Western College, 2019.