Trading Volume: A Barometer for Market Activity
Blog Post by Best Fin Investment
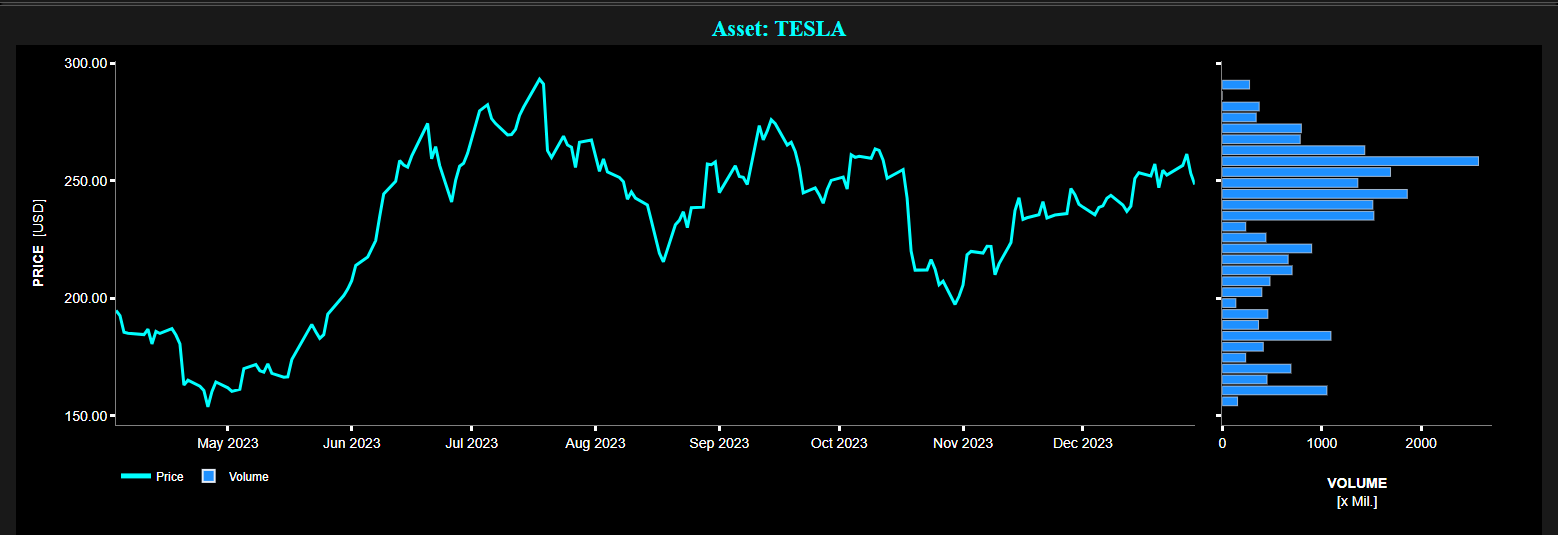
Example of volume profile graph for the TESLA stock.
Left graph: daily stock price (cyan color). Right graph: volume profile bars (blue color).
Time period: April - December 2023.
Source: Best Fin Investment Dashboard.
Table of Contents:
- Introduction
- Volume and Price Movements
- Volume Persistence
- Volume-Volatility Correlation
- Intraday Volume Dynamics
- Volume and Bid-Ask Spreads
- Conclusion
- Explore Volume Metrics on the Best Fin Investment Dashboard
- References
- Related Articles
- Books from the References Section
- Additional Reads on Human Behavior and Behavioral Finance
Introduction:
Trading volume refers to the total number of shares, contracts, or other financial instruments that are traded within a given time period, typically measured on a daily basis. It serves as a key indicator of market activity and liquidity, reflecting the intensity of market interest in a particular asset.
Volume provides clues about the strength and potential sustainability of price trends, market sentiment, and the potential for price volatility. Volume metrics, often used in conjunction with price analysis, also serve as a cornerstone for numerous trading strategies. In this blog post we explore the multifaceted nature of volume by emphasizing its pivotal role in financial markets.
Volume and Price Movements:
There is a relationship between trading volume and price movements in financial markets. High volume often accompanies price trends, indicating strong market conviction, while low volume may indicate a lack of conviction in price movements and may precede periods of consolidation or reversals [3].
Volume Persistence:
Trading volume tends to exhibit persistence or autocorrelation over short time horizons, indicating that current volume levels are influenced by past volume levels. This persistence can be attributed to various factors, including trading strategies, market structure, and information dissemination.
Volume-Volatility Correlation:
Trading volume is correlated with all measures of volatility, however it is somewhat difficult to establish the causality of this relationship [2,4].
Note that volatility refers to the degree of variation in the price of a financial asset over time. It is a statistical measure of the dispersion of returns, typically expressed through metrics like standard deviation or variance. High volatility indicates that the price of the asset can change dramatically over a short period, either increasing or decreasing, while low volatility suggests a more stable price movement.
Intraday Volume Dynamics:
As observed by Professor J.P. Bouchaud: "The typical daily volume activity exhibit a U-shape profile, or better a J-shape profile, with asymmetric peaks at the beginning and end of the day and a minimum at around midday [1]". This means higher trading volume during the opening and closing hours and lower volume during midday. This intraday volume pattern reflects changes in market liquidity, trading activity, and investor behavior [1].
It was also noticed that trading activity during the busiest periods can be approximately four times greater than trading activity during the quietest periods.
It is also worth noting, as pointed out by Professor J.P. Bouchaud, that "the daily traded volume for a typical stock in an equities market usually amounts to roughly 0.1% - 1% of its total market capitalisation. However, the total volume offered for an immediate transaction at any given instant of time is typically very small [1]".
Volume and Bid-Ask Spreads:
Higher trading volumes are typically associated with narrower bid-ask spreads.
Note that the bid-ask spread is the difference between the highest price that a buyer is willing to pay (the bid) for a security and the lowest price that a seller is willing to accept (the ask). It represents the transaction cost for trading a financial asset and is a key indicator of the liquidity of that asset. A narrower bid-ask spread typically indicates a more liquid market, where buyers and sellers can trade in larger volumes with minimal price concessions. Conversely, a wider bid-ask spread often signals lower liquidity, where trading is more sporadic, and participants must accept larger price differences to execute transactions.
When trading volume does increase, the market becomes more liquid, hence facilitating smoother and more efficient transactions. This leads to narrower bid-ask spreads, thus reducing the costs for market participants.
Conclusion:
The relationship between trading volume and various market dynamics, as discussed, underscores its importance as a critical market indicator. As financial markets continue to evolve, staying informed about these aspects of trading volume will remain essential for anyone engaged in market activities, whether they are day traders, long-term investors, or market analysts.
Explore Volume Metrics on the Best Fin Investment Dashboard:
References:
[1] Bouchaud J.P., Bonart J., Donier J., Gould M., "Trades, Quotes and Prices: Financial Markets Under the Microscope", Cambridge University Press, 2018.
[2] Cont R., "Empirical properties of asset returns: stylized facts and statistical issues", Quantitative Finance, vol. 1, issue 2, pp. 223-236, 2001.
[3] Karpoff J.M., "The relation between price changes and trading volume: A survey" Journal of Financial and Quantitative Analysis, vol. 22, issue 1, pp. 109-126, 1987.
[4] Sinclair E., "Volatility Trading", Wiley (2nd Edition), 2013.
Related Articles:
- Price Volatility: Beyond Peaks and Valleys
- Market Liquidity: A Hide and Seek Game between Unobservable Buyers and Sellers