Price Volatility: Beyond Peaks and Valleys
Blog Post by Best Fin Investment
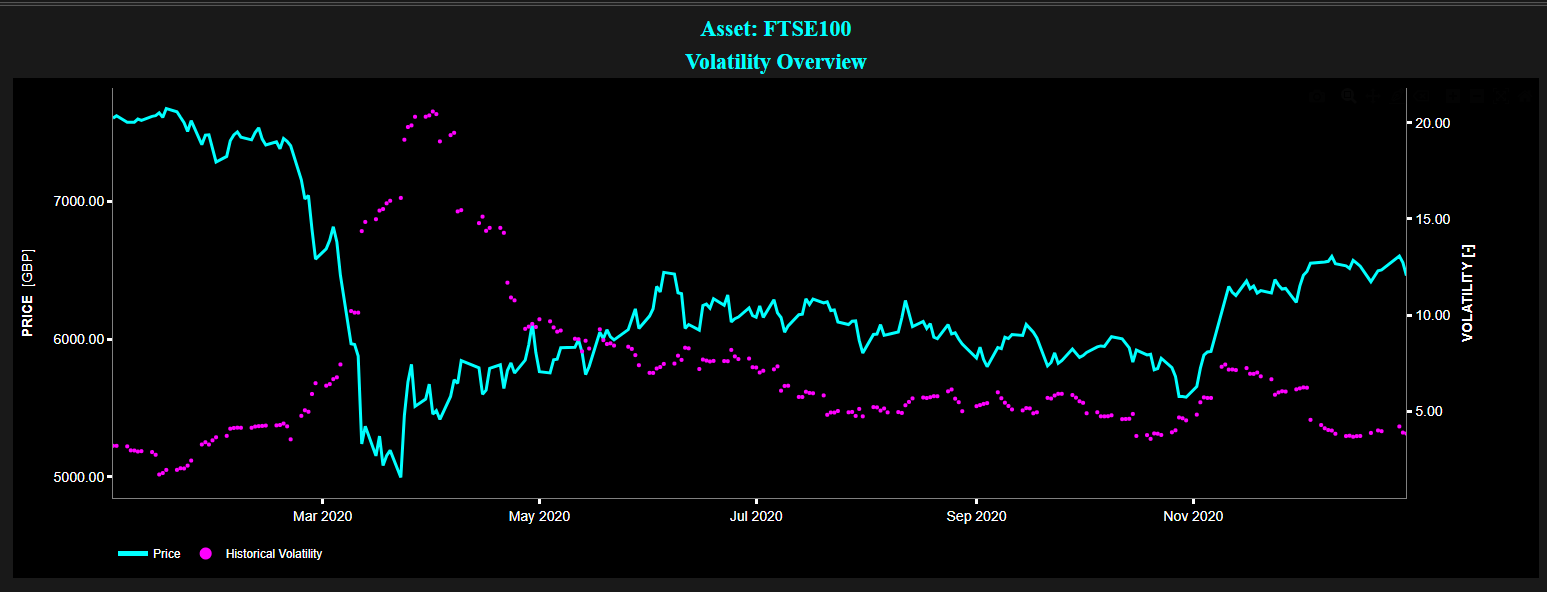
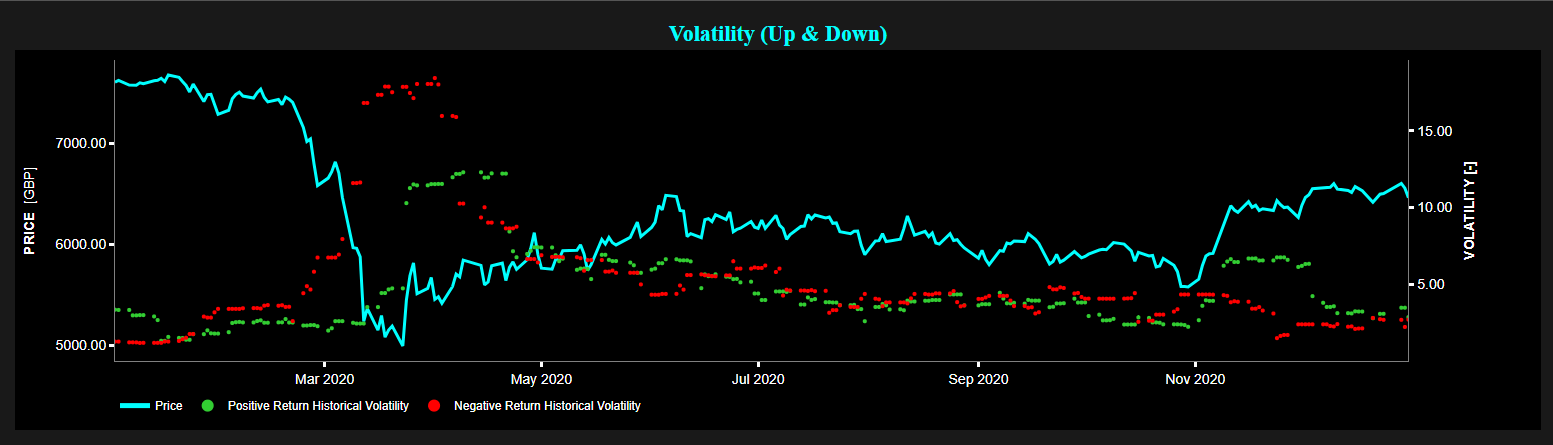
Example of 20-day historical volatility of the FTSE 100 index for January - December 2020.
Top graph: price index (cyan color) and historical volatility (magenta color).
Bottom graph: price index (cyan color), historical volatility of positive returns (green color), and historical volatility of negative returns (red color).
Source: Best Fin Investment Dashboard.
Table of Contents:
- Introduction
- Volatility Clustering
- The Joseph Effect and Long-Range Memory
- Market Dynamics and Endogenous Factors
- Market Dynamics and Exogenous Factors
- Relationship between Volatility, Return, and Liquidity
- The VIX - Barometer of Market Sentiment
- Conclusion
- Explore Volatility Metrics on the Best Fin Investment Dashboard
- References
- Related Articles
- Books from the References Section
- Additional Reads on Human Behavior and Behavioral Finance
Introduction:
Volatility refers to the degree of variation in the price of a financial asset over time. It is a statistical measure of the dispersion of returns, typically expressed through metrics like standard deviation or variance. High volatility indicates that the price of the asset can change dramatically over a short period, either increasing or decreasing, while low volatility suggests a more stable price movement. Note that price fluctuations in financial markets are multi-time scale, in other words there are volatility bursts from all sizes, from seconds to years [3].
Price volatility is a fundamental aspect of financial markets, influencing investment decisions, risk management strategies, and market dynamics. In this blog post we explore the multifaceted nature of price volatility, uncovering key insights from empirical research and market observations. Further, we delve into some of the key stylized facts, i.e. nontrivial statistical properties, surrounding price volatility, shedding some light on their intriguing characteristics and potential implications.
A so-called stylized fact is a feature that is consistent enough to be generally accepted as truth [10].
Volatility Clustering:
One prominent observation in financial markets is related to the so-called volatility clustering, where high-volatility events tend to cluster in time. Research by Professor R. Cont [4] suggests that different measures of volatility display positive autocorrelation over several days, indicating a tendency for volatility to persist.
Additional research performed by Professor J.P. Bouchaud also suggests that an increase of volatility at time t appears to trigger more activity at time t + tau, much like earthquakes are followed by aftershocks [3].
Indeed it is observed that large price jumps are usually followed by an increased frequency of smaller price moves, hence leading to the conclusion that some kind of self-excitation seems to be present in financial markets [3].
To quote Professor J.P. Bouchaud [3] when referring to volatility clustering "This takes place either temporally (some events trigger more events in the future) or across different assets (the activity of one stock spills over to other correlated stocks, or even from one market to another)".
Several explanations have been proposed to explain volatility clustering, e.g. leverage was proposed as a potential cause for volatility clustering [11] but other causes exist such as the incremental execution of large hidden trading orders [3].
The Joseph Effect and Long-Range Memory:
Professor B. Mandelbrot introduced the so-called "Joseph Effect" notion, highlighting the long-term memory inherent in market volatility [8], i.e. to describe the persistence of certain volatility patterns over long periods of time (where past events continue to influence present fluctuations). Volatility may be described as a long-memory process with Hurst exponents in the neighborhood of H ~ 0.75 [6,8], even though for shorter time-scales it was observed that price volatility was found to be, locally at least, mean-reverting [10].
Note that the Hurst exponent H is a measure used to evaluate the long-term memory of time series data. It helps in understanding the degree of autocorrelation within the data, indicating whether the data exhibits persistence or mean-reversion. For H > 0.5, this means that the time series shows long-term positive autocorrelation, meaning that if the series has increased in the past, it is likely to continue increasing. Conversely, for H < 0.5 this means that the time series is mean-reverting, indicating that increases are likely to be followed by decreases, and vice versa.
Market Dynamics and Endogenous Factors:
A growing body of research highlights the endogenous nature of market dynamics, where trading activity itself drives price movements and volatility, implying that market volatility is not mainly due to the rational processing of exogenous news. In fact it is claimed that as much as 80% - 90% of volatility is due to slowly decaying, power-law, self-reflexive feedback of trading activity onto itself [1,2,3]. In addition, it is worth noting that:
- The dynamics of financial markets, and the economy in general, is mostly endogeneous and only very weakly driven by fundamentals [2]. Often we refer here to Professor Shiller's excess volatility puzzle, i.e. the actual volatility of prices appears to be much higher than the one warranted by fluctuations of the underlying fundamental value. Excess volatility can be explained by the sheer impact of noise trading and self-referential feedback loops [3].
- Most intraday jumps appear to be endogenous, induced by the speculative dynamics itself, spontaneously causing liquidity micro-crises [1,3]. Trading intrinsically leads to price instabilities.
- A very large proportion of shocks cannot be attributed to idiosyncratic news (i.e. a news item containing the ticker of a given stock) [1,4,5].
- Most high frequency dynamics are due to fluctuations in order flow [1,3].
Market Dynamics and Exogenous Factors:
Although the majority of high-frequency price movements are primarily self-generated, it is likely that the lower-frequency ones are dominated by exogenous factors [12].
Here changes in national income, exchange rates, changes in interest rates, and changes in the rate of inflation can have a systematic influence on lower-frequency stock returns [7].
Now regarding the impact of news, we refer here to Professor J.P. Bouchaud's observation: "The volatility after a no-news jump relaxed more slowly than after a news. This could be due to the fact that a jump without any clear explanation makes traders anxious for a longer time than if a well identified event caused the jump [1]".
Relationship between Volatility, Return, and Liquidity:
- Most measures of volatility of an asset are negatively correlated with the returns of that asset [4].
- Positive past returns tend to decrease future volatilities [3].
- Negative past returns tend to increase future volatilities [3].
- Periods of high volatility correspond to low liquidity and vice versa [9]. Note that liquidity refers to the ease with which an asset can be bought or sold in the market without affecting its price significantly (essentially measuring how quickly and at what cost an asset can be converted into cash).
The VIX - Barometer of Market Sentiment:
The Volatility Index (VIX), created by the Chicago Board Options Exchange (CBOE), is a real-time market index that represents the market's expectations for volatility over the coming 30 days. Often referred to as the "fear gauge" the VIX is widely considered the premier measure of market risk and investor sentiment, especially during times of market stress.
The VIX is derived from the price inputs of S&P 500 index options, both calls and puts, and is calculated using the implied volatilities of a wide range of options. It reflects the market's expectation of 30-day forward-looking volatility, essentially predicting how much the S&P 500 index is expected to fluctuate in the near future.
The VIX primarily reflects investors' concerns about downside risk, rather than their optimism during market rallies [13].
Conclusion:
The study of price volatility unveils a rich tapestry of insights into financial market dynamics. From volatility clustering to the intricate relationship between volatility and returns, understanding these phenomena is essential for analysts, traders, and investors.
Explore Volatility Metrics on the Best Fin Investment Dashboard:
- Historical Observations
- Clustering (Ljung-Box Test)
- Jumps (Cumulative Sum Test)
- Jumps (Lee-Mykland Test)
- Jumps (Range Test)
- Persistence (Autocorrelation Test)
- Persistence (Hurst Exponent)
- Persistence (GJR-GARCH Model)
- Persistence (FIGARCH Model)
References:
[1] Bouchaud J.P., "The endogenous dynamics of markets: price impact, feedback loops and instabilities", Lessons from the credit crisis, pp.345-74, 2011.
[2] Bouchaud J.P., "Viewpoints on emergent phenomena in non-equilibrium systems", Talk at Higgs Centre for Theoretical Physics, 2014.
[3] Bouchaud J.P., Bonart J., Donier J., Gould M., "Trades, Quotes and Prices: Financial Markets Under the Microscope", Cambridge University Press, 2018.
[4] Cont R., "Empirical properties of asset returns: stylized facts and statistical issues", Quantitative Finance, vol. 1, issue 2, pp. 223-236, 2001.
[5] Cutler D.M., Poterba J. M., Summers L.H., "What moves stock prices?", The Journal of Portfolio Management, vol. 15, issue 3, pp. 4-12, 1989.
[6] Lillo F., Gillemot L., Doyne Farmer J., "There's more to volatility than volume", Quantitative Finance, vol. 6, issue 5, pp. 371-384, 2006.
[7] Malkiel B.G., "A Random Walk Down Wall Street: The Time-Tested Strategy for Successful Investing", W.W. Norton & Company, 2020.
[8] Mandelbrot B., Hudson R.L., "The (Mis)Behaviour of Markets: A Fractal View of Risk, Ruin and Reward", Profile Books Ltd , 2008.
[9] Mike S., Doyne Farmer J., "An empirical behavioral model of liquidity and volatility", Journal of Economic Dynamics and Control, vol. 32, issue 1, pp. 200–234, 2008.
[10] Sinclair E., "Volatility Trading", Wiley (2nd Edition), 2013.
[11] Thurner S., Doyne Farmer J., Geanakoplos J., "Leverage causes fat tails and clustered volatility", Quantitative Finance, vol. 12, issue 5, pp. 695-707, 2012.
[12] Wawrzyniak K., Wislicki W., "Grand canonical minority game as a sign predictor", In Kamiński, B., Koloch, G. (eds) Advances in Social Simulation. Advances in Intelligent Systems and Computing, vol 229. Springer, 2017.
[13] Whaley R., "Understanding VIX", SSRN Electronic Journal 38, 2008.