Trading Strategies: From Momentum to Mean-Reversion
Blog Post by Best Fin Investment
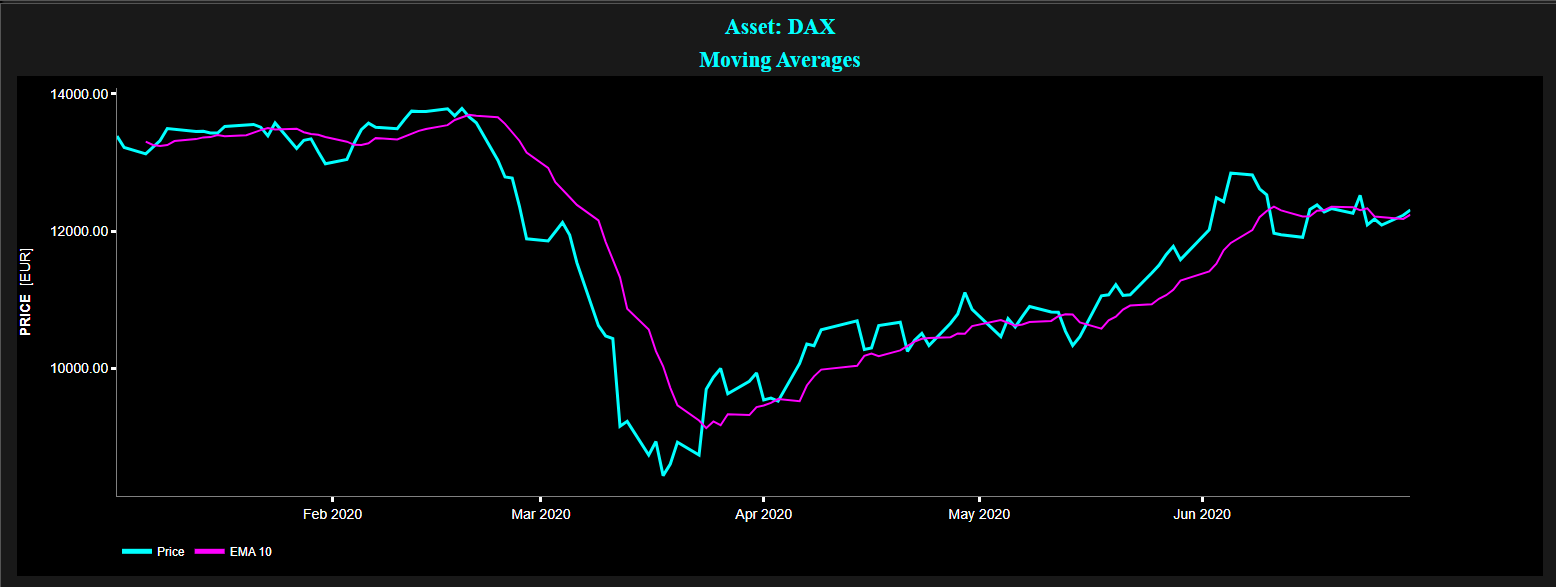
Example of 10-Day Exponential Moving Average (EMA) using daily quotes of the DAX Index for January - June 2020.
Graph: DAX Index (cyan color) and corresponding 10-Day EMA (magenta color).
Source: Best Fin Investment Dashboard.
Table of Contents:
- Introduction
- Types of Investors
- Trading is Hard
- Short-Term versus Long-Term Strategies
- The Mechanics of Momentum-Based Trading Strategies
- Key Considerations for Momentum Trading
- The Mechanics of Mean-Reversion Trading Strategies
- Key Considerations for Mean-Reversion Trading
- Additional Topic: Implied vs. Realized Volatility Trading
- Top 20 Trading and Investment Guidelines for Retail Traders
- Conclusion
- Explore Trend & Mean Reversion on the Best Fin Investment Dashboard
- Explore Also Pairs Trading on the Best Fin Investment Dashboard
- References
- Related Articles
- Books from the References Section
- Follow-Up Reading Suggestions for Trading Enthusiasts
- Additional Reads on Human Behavior and Behavioral Finance
Introduction:
Investing in financial markets involves a wide range of strategies, each tailored to different types of investors and market conditions. Traders often rely on momentum strategies, which seek to capitalize on trending markets, or mean-reversion strategies, which exploit price deviations from historical norms. Beyond these, other strategies, such as volatility trading, focus on the spread between implied and realized volatility, providing opportunities in fluctuating markets. Successfully applying any of these approaches requires a deep understanding of market dynamics and investor behavior. This blog explores the mechanics of these trading strategies, the challenges they present, and the key factors necessary for their effective implementation.
Types of Investors:
Investors generally fall into two primary categories: passive and active.
Passive Investors: These investors adopt a buy-and-hold strategy, often utilizing index funds to achieve broad market exposure. An index fund is a type of mutual fund or Exchange-Traded Fund (ETF) designed to replicate the performance of a specific market index, such as the S&P 500.
By mirroring the holdings of these indexes, index funds offer diversification across various sectors and industries.
They are particularly known for their cost efficiency, as they typically have lower expense ratios compared to actively managed funds, primarily due to reduced management and transaction costs.
This cost-effectiveness can lead to higher net returns over time. Additionally, index funds provide tax advantages, as their lower turnover rates result in fewer taxable events for investors.
As of year-end 2023, the amount invested in global passive equity funds had surpassed that in traditional active funds. Indeed, global passive equity funds accounted for approximaely USD 15.1 trillion in Assets Under Management (AUM), whereas active funds managed were USD 14.3 trillion [19].
Active Investors: In contrast, active investors take a more hands-on approach, aiming to outperform market averages through various strategies. Nobel laureate Professor Robert Shiller distinguishes between two key types of active market participants:
- Rational arbitrageurs, also known as "smart money" traders or rational speculators. These investors form well-informed, data-driven expectations about asset returns and seek to exploit mispricings in the market [5].
- Noise traders, sometimes referred to as liquidity traders. These investors make decisions based on sentiment, personal expectations, or behavioral biases rather than quantitative considerations or fundamental economic data. Their actions can create short-term market inefficiencies, which more informed investors may exploit [5].
Understanding these investor categories and their respective strategies is crucial for anyone looking to navigate the complexities of financial markets effectively.
Trading is Hard:
Yogi Berra, renowned American professional baseball player, coach, and manager, famously said "predictions are hard, especially about the future".
Indeed according to Professor B.G. Malkiel "Only 3% of the 358 mutual funds that were in existence in 1970 beat the S&P 500 market index by an average of 1% or more during the period 1970 - 2017". [10] Hence beating the market, consistently, is really hard although it is well-known that market predictability does exist to some extent [2].
There is indeed empirical evidence suggesting that some signals, derived from either fundamental analysis or quantitative and technical analysis, are correlated with future price changes, but unfortunately profitable trading opportunities do remain somewhat elusive due to a range of factors:
- Very weak signal-to-noise ratios, i.e. very weak correlations, meaning that in general the information contained in the signals used by traders or investors is extremely weak [2].
- It is extremely difficult to separate skill from luck in trading performance. In trading and investing, luck weighs heavily on the outcomes in the short-term [13]. As pointed out by Professor J.P. Bouchaud "using numbers from real markets illustrates that evaluating real trading strategies is very difficult. Given a stock with an annual volatility of 15% and a reported annual return of 5%, it would take almost 9 years to test whether the actual return was statistically significantly different from zero at the one-sigma level. Therefore it can take a very long time to notice that a seemingly lucrative trading strategy is actually flawed, or vice-versa". [2]
- Rapid exploitation of trading opportunities leading to their subsequent disappearance. It is well-known that "arbitrage tends to whiten the spectrum of price changes", meaning that the mere act of trading an opportunity will eventually make it vanish [11].
This characteristic gets exacerbated by the strong competition from all market participants, in particular from the so-called "smart money" side (e.g. quantitative hedge funds and other mutual funds, asset management funds, etc).
- The cost of trading. Many trading strategies may appear profitable during backtests, but these strategies may often turn unprofitable when the costs of trading are factored in.
Costs may be subdivided into direct costs such as transaction fees, commissions and taxes and indirect costs such as bid-ask spreads and market impact [4].
Transaction fees are paid to brokers or trading platforms every time an asset is bought or sold. They can be flat fees or based on the volume of the trade order.
The bid (buyers) vs. ask (sellers) spread is the difference between the price at which a market participant can buy or sell an asset.
This spread represents an implicit cost to a trader. Wider spreads increase the cost of entering and exiting positions, especially in less liquid markets where spreads tend to be larger.
Finally market impact refers to the effect that a trader's buy or sell order may have on the price of the asset being traded.
In particular, large orders can cause prices to move unfavorably against the trader, increasing the cost of buying or decreasing the proceeds from selling.
- Market "Timing" matters greatly as big gains and losses may tend to concentrate into small packages of time [12], but accurate market "Timing" is far from being trivial.
As noted by Professor B.G. Malkiel "Laszlo Birinyi, in his book "Master Trader", has calculated that a buy-and-hold investor would have seen one dollar invested in the Dow Jones Industrial Average in 1900 grow to $290 by the start of 2013. Had that investor missed the best five days each year, however, that dollar investment would have been worth less than a penny in 2013." [10]
This analysis shows that extreme-return days play a much more crucial role in shaping the market's total return than a normal distribution of market returns would suggest [14].
Indeed, as noted by Professor M.J. Mauboussin "one of the major challenges in investing is how to capture (or avoid) low-probability, high-impact events." [14]
- Appropriate risk management is mandatory as losing trades tend to cluster together in time, as can winning trades [16]. It is also further interesting to note that concentration seems to be prevalent in our physical world (e.g. concentration of gold deposits or oil reservoirs around the world) and indeed across financial markets as well.
Professor B. Mandelbrot referred to market time as a relative concept, beautifully summarized as follows "markets operate on their own trading time, quite distinct from the linear clock time in which we normally think. This trading time speeds up the clock in periods of high volatility, and slows it down in periods of stability (i.e. low volatility)" [12].
This implies that significant market changes can happen rapidly during volatile periods, while during stable periods, market changes occur more slowly.
- We see patterns where none exist [14]. As noted by Professor M. Mauboussin "researchers at the University of Rochester observed that more than 50% of the Human brain cortex is devoted to processing visual information" [14].
Hence, humans are superb at recognizing and matching patterns, particularly visual patterns, which makes humans superb inductive machines. Unfortunately humans also have the tendency to see patterns where none exist, particularly when looking at financial charts. This is because perfectly random time series will typically present some detectable visual patterns [18].
- Business and investing are examples of realms where intuition often fails [8,13]. Indeed, intuitions works primarily when the environment is stable and an individual has the opportunity to spend a great deal of time learning about that environment [8,13]. Unfortunately, financial markets are notorious for their constantly changing nature.
- Psychological hurdles associated with the so-called minority rule. Traders whose actions counteract those of the majority may profit most [15]. However, from a psychological viewpoint, it is not easy to choose a path that goes against the crowd, since investing is inherently a social activity, where imitation plays a prime role [14].
Short-Term versus Long-Term Strategies:
We distinguish the following approaches.
- Short-Term Strategies. These include intraday trading strategies that typically exploit predictable aspects of market microstructure [2]. High-frequency trading (HFT) algorithms, for example, capitalize on small, consistent anomalies in price movements.
- Long-term Forecasting. Investors with longer horizons, ranging from weeks to months, often rely on linear tools such as moving averages and autocorrelation analyses. However, they must account for increasing uncertainty over extended time frames [2]. It is also good practice to supplement these predictions with broader economic indicators or sector-specific trends.
- Adaptive Approaches. As Professor J.P. Bouchaud notes, "the variability in predictability across different time scales suggests that traders and investors might benefit from adaptive strategies that can switch between different models and analyses depending on the prevailing market conditions and the time scale of interest" [2]. This underscores the scale-dependent nature of market predictability and highlights the importance of using appropriate models and expectations for different trading horizons [8].
The Mechanics of Momentum-Based Trading Strategies:
Momentum strategies, also known as trend strategies, capitalize on situations where asset prices demonstrate a trending or persistent behavior, characterized by a positive correlation between past and future returns in a price series.
There is indeed evidence of trend patterns in financial asset prices [7], which may be caused by a range of potential factors:
- The forced sales or forced purchase of assets. Large institutional investors, such as hedge funds or mutual funds, may be forced to buy or sell assets due to margin calls, redemptions, or risk management mandates. When this happens, these large trades can create short-term trends in asset prices, which momentum traders seek to exploit.
- Slow diffusion of new information. In an efficient market, new information should be reflected in asset prices almost immediately. However, in reality, investors react to news at different speeds due to cognitive biases, liquidity constraints, or delays in processing and acting on information. As a result, asset prices may gradually adjust rather than move instantly to a new equilibrium. This slow adjustment creates short-term trends that momentum traders can capture by entering positions early in the price movement before the full impact of the news is priced in.
- The conservatism cognitive bias, which leads to underreaction. Most individuals may tend to slowly revise their prior beliefs when presented with new information.
In such cases, individuals may tend to hold on to their original views or forecasts.
When individuals do eventually adjust their views, the process is very gradual.
This sluggish adaptation results in an underreaction of security prices, as the new information slowly becomes priced in.
Consequently, this slow adjustment contributes to momentum (or trend) in returns [17].
- The hide and seek games of financial markets. As summarized by Professor J.P. Bouchaud "empirical observations show that markets operate in a so-called regime of vanishing revealed liquidity, coupled with large latent liquidity" [1].
Essentially, markets are hide and seek games between unobservable buyers and sellers that have to funnel their orders through a rather small liquidity drain.
Consequently, the trades of medium to large institutions can only be executed incrementally, over a period of days or even weeks.
- Insensitivity to price changes. Trade fragmentation, as outlined by Professor J.P. Bouchaud is a "direct evidence that most investors are, to some degree, insensitive to price changes. Once the decision to buy has been made, the trade is completed even if the price moves up and down, at least within some bounds on the order of a few days or a few weeks of volatility" [2].
- Market "manipulation" by High-Frequency Traders (HFT) [3]. Essentially this strategy, sometimes known as stop-hunting, relies on triggering stop-orders that typically populate round numbers near the current market price, or near support and resistance levels.
For example, and in the specific case of a support level, as mentioned by Dr. E.P. Chan "these traders may decide to submit large sell orders when the price is close enough to a support level, hoping to drive the next tick down. Once the stop orders are triggered and a downward momentum is in force, these traders can cover their short positions for a quick profit" [3].
Obviously, similar strategies may also apply towards resistance levels.
- Intraday momentum at shortest time-scales. Such intraday strategies are often related to the so-called market microstructure characteristics, e.g. imbalance of bid and ask sizes, changes in order flow, or nonuniform distributions of stop-loss orders [2,17].
Key Considerations for Momentum Trading:
Momentum strategies are a popular approach in trading, but they come with unique characteristics and challenges:
- Need for high market volatility. These strategies tend to thrive in environments with relatively high volatility, which provides the price movement necessary for momentum to be profitable. Using technical terms, this means that the thicker the tails of the return distribution curve, i.e. the higher its kurtosis, the better that financial market is for momentum strategies. In other words, the more often a "black swan" event may occur, the more likely that a momentum strategy may benefit from it [3].
- Few trading opportunities. Many established momentum strategies have long lookback and holding periods, so the number of independent signals may be few and far between [3].
- Low Sharpe ratios. In general it is rather hard to create profitable momentum strategies, and those that are profitable tend to have lower Sharpe ratios than mean-reversion strategies [3].
Note that the Sharpe ratio is a measure that compares the return of an investment with its risk. The Sharpe ratio is calculated by dividing the excess return of an investment by the standard deviation of returns. A higher Sharpe ratio indicates better risk-adjusted returns.
- Ease in risk management. Momentum strategies do in general enjoy the benefit of ease in risk management, e.g. through the inclusion of stop-losses. Hence, momentum strategies may have unlimited upside (if take-profits are not set) and limited downside (through stop-losses).
- Good data quality is in general important for all trading strategies, but particularly more so for intraday approaches at shortest time-scales [3].
The Mechanics of Mean-Reversion Trading Strategies:
Mean-reversion strategies are built on the premise that asset prices, after experiencing significant deviations from their historical averages, tend to revert to their long-term mean over time. Unlike momentum strategies, which seek to capitalize on trends, mean-reversion trading assumes that extreme price movements are often temporary and that assets will eventually return to a more balanced state. This approach is commonly applied in individual asset trading, as well as in pair trading, where traders identify two historically correlated assets that have diverged and take offsetting positions to profit from their eventual convergence.
Several underlying mechanisms contribute to the tendency of asset prices to revert to their mean, including market forces, behavioral biases, and liquidity constraints. Some of the key drivers of mean reversion include:
- Rebalancing of portfolios by institutional investors, which can create price pressures that are eventually corrected. Large institutional investors, such as pension funds and mutual funds, periodically adjust their asset allocations to maintain target portfolio weights. For example, if stocks outperform bonds in a given period, portfolio managers may sell stocks and buy bonds to restore the desired balance. This forced buying and selling can temporarily push prices away from their fair value, creating opportunities for mean-reversion traders who anticipate a return to equilibrium once the rebalancing effect subsides.
- Overreaction to news or external events, where prices initially move too far in one direction and then correct back towards the mean [17]. Financial markets are driven by human psychology, and investors often overreact to news, whether positive or negative. For example, a company announcing worse-than-expected earnings may experience a sharp sell-off due to panic selling, even if the long-term fundamentals remain strong. Similarly, a stock receiving positive news may surge beyond its fair value due to excessive optimism.
- Short-term traders moving opposite to long-term investors, and betting that the long-term imbalance will correct itself [12]. High-frequency traders and short-term speculators often amplify price movements by chasing momentum, pushing prices away from their fair value. Meanwhile, long-term investors, such as value investors and fundamental analysts, recognize these mispricings and take contrarian positions. As long-term capital flows back into undervalued assets and out of overvalued ones, prices tend to revert toward their historical average, creating opportunities for mean-reversion strategies.
- Market dynamics where prices overshoot due to liquidity constraints, or other temporary factors and eventually normalize. In times of low liquidity, even relatively small trades can cause significant price swings, leading to temporary mispricings. For example, if an asset is thinly traded or market makers step away during high volatility, prices may move beyond what fundamentals justify. Once liquidity normalizes and trading activity returns to normal, prices tend to revert to their fair value.
Key Considerations for Mean-Reversion Trading:
Mean-Reversion strategies are a popular approach in trading, but they also come with unique characteristics and challenges:
- Need for constant volatility levels. Mean-reverting strategies tend to thrive on a constant level of volatility [3].
- The ability to endure initial and unrealized trade losses. It is indeed highly likely that a mean-reverting position will initially start by losing money. As elegantly expressed by Dr. Sinclair "you enter a position because it has deviated from fair value. It will often continue to deviate further. Once something is mispriced there is no reason it cannot become even more mispriced". [17]
- Complicated risk management perspective. The use of stop-losses may not be applicable since they are not consistent with mean-reverting strategies, as they tend to contradict these strategies' entry signals [3]. Hence, mean-reversion strategies have limited upside and potentially unlimited downside (absence of stop-losses).
- Need for good timing. A key to success with mean-reversion strategies is proper timing. However, it is well-known that market timing is hard and risky!
- Stocks pair trading may require specific attention. Such specific matters include: i) potential short-sale constraints, particularly when shorting hard-to-borrow stocks, and ii) the 2010 uptick rule (a measure that in some situations may be triggered to prevent excessive short selling) [3].
- Again, good data quality is in general important for all trading strategies, but particularly more so for intraday approaches at shortest time-scales [3].
As a final remark, be aware that financial time series may often exhibit, both, momentum and mean-reversion patterns, but at different time scales [3].
Additional Topic: Implied vs. Realized Volatility Trading:
The idea here consists in trading the spread between the implied volatility, i.e., the future volatility implied by the options market, and the forecasting of realized volatility. This could be done through the use of specific options contracts.
One would then start trading when the forecast volatility diverges significantly from the implied volatility.
For example, for stock indices, implied volatility may often be higher than realized volatility, and implied volatility may move more slowly than realized volatility, particularly when the implied volatility is low (e.g., VIX < 35) or in a declining VIX environment [17].
Now the discrepancy between implied and realized volatility provides an opportunity for traders to capitalize on market mispricings and fluctuations.
These opportunities may likely arise in situations where the market is in a state of either overreaction or underreaction.
Note that we briefly mentioned the VIX Index here above. The VIX, formally known as the Chicago Board Options Exchange (CBOE) Volatility Index, is a popular measure of the stock market's expectation of volatility implied by S&P 500 index options. The VIX Index is often referred to as the "fear gauge" or "fear index", and it represents one-month forward-looking volatility.
Traders frequently use the VIX as an important tool when constructing trading strategies, as it helps gauge market sentiment and potential volatility levels.
Top 20 Trading and Investment Guidelines for Retail Traders:
In this section, key guidelines are outlined to help retail traders manage risks, capitalize on market opportunities, and maintain discipline in the face of market randomness and uncertainty.
1 - Focus on the process! Trading & investing are typical examples of probabilistic fields, where past performance is no guarantee of future results because there is too much randomness and luck involved in investing. In such environments, one ought to focus on the decision-making process rather than on short-term outcomes [13,14].
2 - Use stop losses! Limit risk on each trade to 0.5%, or lower, of total equity [16]. Keeping losses as small as possible is critical to capital preservation.
3 - Embrace a robust risk management strategy. Remember that losing trades can cluster together in time, as can winning trades [16]. This underscores the importance of having strong safeguards in place to protect your capital during these streaks.
4 - Use take profits. Set multiple incremental targets, e.g. from 0.5% to 2% of total equity [16]. Do not exit a profitable trade all at once.
5 - Close some of the positions when you achieve quick, substantial gains. Irrespective of take profits targets, take money off the table when making quick large gains [16].
6 - Close a trade after a certain amount of time elapses [16]. Markets are constantly shifting, and the effectiveness of a trade setup may diminish over time. If a trade is not progressing as expected within a predetermined period, it may be best to close it rather than risk increased uncertainty. This rule helps prevent holding onto stagnant or losing trades in the hope of a turnaround, which can often lead to greater losses.
7 - Always wait for the right signal settings! Do not chase the markets, do not succumb to the fear of missing out [16], just wait for your signal based on market's action, as Jesse Livermore used to say "you make your money in the sitting" [6].
In his enlightening book J. Schwager notes that "one trader mentioned that in 2017 nearly all of his profits came from 2 weeks in June and one day in December, that's it!" [16].
Hence that is also why J. Schwager mentions that "staring at financial screens all day long is like a casino inviting you to click. You have to guard against the temptation of taking impulsive trades. Trading is the space between the trades (...) It is what you DO NOT do between the real trade opportunities that will determine your success over the long run". [16]
8 - Follow your signal settings, do not override them. Overriding is only allowed during exceptional circumstances such as, for example, during the Covid-19 crash or the 2008 financial crisis.
9 - Lean towards simple and robust strategies. Successful and robust trading strategies should typically be as simple as possible, and use as few rules and parameters as possible. Also avoid frequent strategy recalibrations [3,9,16,17].
10 - Be wary of over-optimized backtest results. This may likely lead to data snooping, i.e. basically by fitting a trading rule on past data [9]. As pointed out by Professor N. Taleb "the more I try, the more I am likely, by mere luck, to find a rule that worked on past data" [18]. Remember that a random time series will always present some detectable patterns [18]. Note also that it is well-known that the performance during live trading usually drops by a factor ranging from 2.5 to 5 compared to backtest results! [9,16]
11 - Remember the benefits of diversification. For instance, it is more effective to build a diverse collection of simple trading systems than to keep adding rules and re-optimize a single large trading system [16].
12 - Preferably avoid derivatives trading. This is a highly sophisticated and complex environment where the risks are large and the transactions-cost savings typically available to institutions are usually unavailable for retail participants [10].
13 - Preferably trade longer time frames, e.g. in the range of 2 to 6 months patterns [16]. Indeed, as pointed out by Professor M. Mauboussin "information about what is going on now, or what is likely to happen in the near future, is most likely to be efficiently priced into stocks. In contrast, some evidence suggests that the market is short sighted with regard to longer-term information" [14].
14 - If you do trade short-term timeframes, avoid keeping overnight positions. Short-term traders, especially day traders and scalpers, should be cautious about holding positions overnight due to unexpected market movements. Overnight price gaps, news events, or macroeconomic data releases can trigger volatility that could move against your position. Holding trades overnight also exposes you to additional costs such as swap fees or financing charges, depending on your broker and the asset class.
15 - If you do trade short-term timeframes, and in case the market moves against you, tighten your stop loss to get out as soon as possible. For example, as mentioned by J. Schwager "when getting into a short-term trend following trade you would expect it to work straight away if you are right. If there is any sign that the market is not doing that, then the premise for your trade is eliminated" [16]. In such a case, there is no reason to wait for the stop loss to get hit, you may even close the losing position within the first 20 to 30 seconds if necessary.
16 - Do not trade too often. Trading entails considerable costs (brokerage fees, transactions fees, and price impact). As pointed out by Professor J.P. Bouchaud "the overall nagging feeling is that speculative traders trade too much, probably as a result of overestimating the predictive power of their signals and underestimating the costs of doing so" [2].
17 - Take advantage of times when there is increased liquidity, i.e. lower bid-ask spreads, to for example take profits on your open positions [16]. Traders should strategically time their exits to avoid illiquid periods, which often come with wider spreads and slippage. For instance, closing a position during peak hours rather than in low-volume after-hours trading can lead to better execution and improved profitability. Also note that institutional traders are more active in high-liquidity periods, thus leading to smoother price action and reduced risk of price manipulation.
18 - Have another occupation or activity next to trading. Patience to wait for the right trade opportunity has been cited as one of the most valuable traits by multiple traders [16]. It is perhaps also one of the most challenging qualities to acquire, hence have another occupation or activity next to trading [16].
19 - Do not see trading as a steady source of income. Trading opportunities are dispersed, one might have an opportunity today and then have to wait 3 months for the next opportunity [16]. As mentioned by J. Schwager "this reality may be hard to accept, because one may want to make a steady income from trading, but unfortunately it does not work that way" [16].
20 - Finally, remember that financial markets are constantly adapting, and hence trading systems have a limited lifespan. This implies the need for constant innovation and for constant new research in order to discover new profitable trading strategies [8].
Conclusion:
Despite the prominence of successful arbitrage strategies, prices are notoriously hard to predict. Hence, navigating the complexities of financial markets requires a deep understanding of the different strategies and the conditions under which they thrive.
Whether employing momentum strategies that capitalize on trending behaviors, mean-reversion strategies that exploit price deviations, or volatility trading that leverage discrepancies between implied and realized volatility, traders and investors must carefully consider the market environment and the types of participants driving price movements.
But remember that trading is hard! It is indeed well-known that "the act of trading will eventually cause the edge to dissipate" [17], hence consistent profitability will require consistent adaptation and innovation.
Explore Trend & Mean Reversion on the Best Fin Investment Dashboard:
- Simple Moving Average
- Exponential Moving Average
- Relative Strength Index
- Hurst Exponent
- Half-Life Decay
- Mann-Kendall Test
- Hodrick-Prescott Filter
- Detrended Fluctuation Analysis
Explore Also Pairs Trading on the Best Fin Investment Dashboard:
References:
[1] Bouchaud J.P., "The endogenous dynamics of markets: price impact, feedback loops and instabilities", Lessons from the credit crisis, pp.345-74, 2011.
[2] Bouchaud J.P., Bonart J., Donier J., Gould M., "Trades, Quotes and Prices: Financial Markets Under the Microscope", Cambridge University Press, 2018.
[3] Chan E.P., "Algorithmic Trading: Winning Strategies and Their Rationale", Wiley, 2013.
[4] Dupernex S., "Why might share prices follow a random walk?", Student Economic Review, vol. 21, pp. 167-179, 2007.
[5] Hommes C., "Heterogeneous agent models in economics and finance", Chapter 23 in Handbook of Computational Economics 2, pp. 1109–1186, 2006.
[6] Lefevre E., "Reminiscences of a Stock Operator", Ixia Press, 2023.
[7] Lemperiere Y., Deremble C., Seager P., Potters M., Bouchaud J.P., "Two centuries of trend following", J. Invest. Strateg., vol. 3, issue 3, pp. 41-61, 2014.
[8] Lo A.W., "Adaptive Markets: Financial Evolution at the Speed of Thought", Princeton University Press, 2019.
[9] Lopez de Prado M., "Advances in Financial Machine Learning", Wiley, 2018.
[10] Malkiel B.G., "A Random Walk Down Wall Street: The Time-Tested Strategy for Successful Investing", W.W. Norton & Company, 2020.
[11] Mandelbrot B., "When can prices be arbitraged efficiently? A limit to the validity of random walk and martingale models", Rev. Economics Statistics, vol. 53, pp. 225–36, 1971.
[12] Mandelbrot B., Hudson R.L., "The (Mis)Behaviour of Markets: A Fractal View of Risk, Ruin and Reward", Profile Books Ltd , 2008.
[13] Mauboussin M.J., "The Success Equation: Untangling Skill and Luck in Business, Sports, and Investing", Harvard Business Review Press, 2012.
[14] Mauboussin M.J., "More Than You Know: Finding Financial Wisdom In Unconventional Places", Columbia University Press, 2013.
[15] Patzelt F., Pawelzik K., "An inherent instability of efficient markets", Sci Rep 3, issue 2784, 2013.
[16] Schwager J.D., "Unknown Market Wizards", Harriman House, 2020.
[17] Sinclair E., "Volatility Trading", Wiley (2nd Edition), 2013.
[18] Taleb N.N., "Fooled by Randomness: The Hidden Role of Chance in Life and in the Markets", Penguin Books, 2004.
[19] Weblink, LSEG Lipper via Reuters: https://www.reuters.com/markets/us/global-markets-funds-passive-2024-02-01/